


Automating Land Analysis
Automation and AI are unlocking new ways to evaluate sites, potentially transforming real estate development. Here's how it works.

Today’s Thesis Driven is a guest letter by Dylan Goren, co-founder and CEO of Pillar, a software company automating land acquisitions.

Real estate developers and brokers spend meaningful time and effort sourcing suitable land for new projects. Advances in AI in combination with the widespread availability of digitalized, publicly accessible data are remaking land analysis—historically a manual slog—into an automated process. As the technology and data improves, this has the potential to create new opportunities and transform the real estate development business.
This letter outlines a practical, step-by-step guide to automate land analysis by chaining modern technologies together to complete the same rote, manual tasks often accepted as a reality of the land acquisition job today. The approach of software automation here will be showcased through a specific example of a land search for a large-scale, single-family development opportunity in Tennessee.
We will cover:
Submarket identification using points of interest like schools to systematically draw boundaries.
Site selection using geospatial data, AI, and Python to build a buy box and find assemblages matching it.
Owner outreach using mailing automation platforms to send hundreds to thousands of letters to qualified land owners.
Getting Started: Downloading Parcel Boundaries
The starting ingredient to our analysis is digital parcel boundaries. If analyzing only one municipality or county, finding a public download link or submitting a FOIA request for parcel data is a fine starting point. However, to scale this analysis we will require a more standardized dataset than most governments offer.
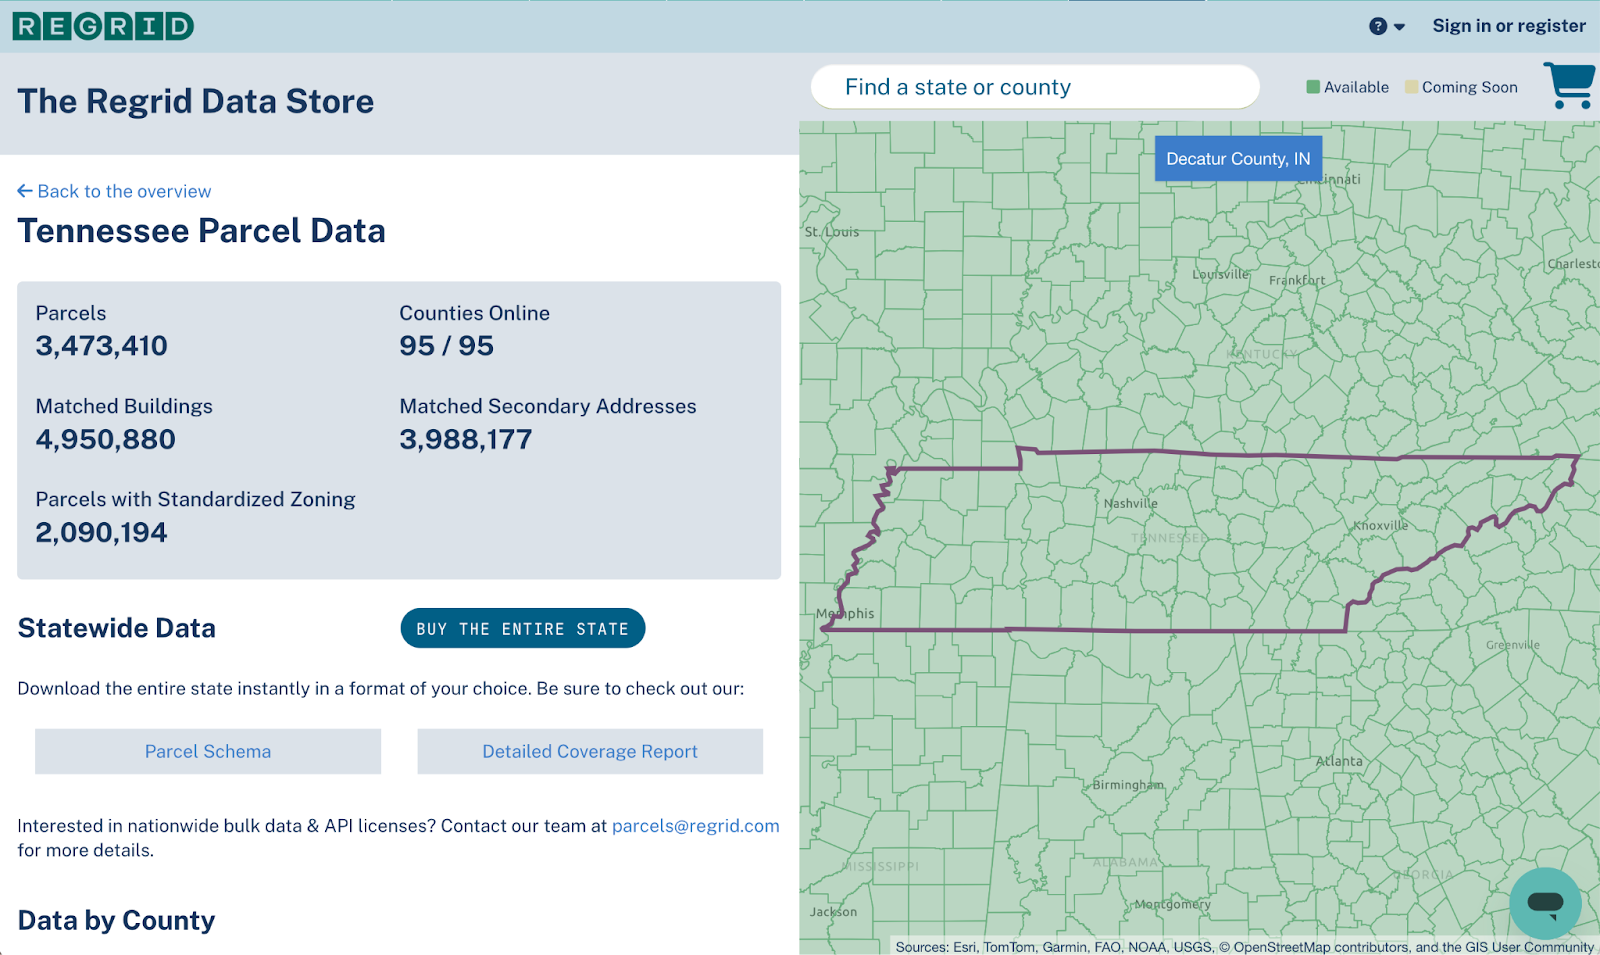
When looking for land in states like Tennessee, Florida, or North Carolina, it’s possible to take advantage of statewide parcel datasets that those governments compile and make free to download. However, even those “statewide” datasets are often incomplete and unstandardized. For example: Davidson County, TN (which holds a part of the Nashville MSA) is excluded from Tennessee’s “statewide” dataset. Plus, Tennessee's statewide dataset is formatted differently from Florida and North Carolina’s. Aggregating and standardizing this data is possible but complicated and time-consuming.
The faster alternative is to buy data from a provider like Regrid or ReportAll. Both offer online storefronts to purchase standardized parcel data at the county, state, or national level. This data can be expensive, but even paying $300 per county can be justifiable given the return on a successful 100-home development. Given our goal of saving time through automation, we will buy the standardized parcel data in this example.
Step 1: Submarket Identification
With our parcel data downloaded, the first step is to define our market boundaries. The United States has more than 2.26 billion acres of land—most of which will not meet basic requirements for a development project. While today’s computers are powerful, analyzing the entire USA’s land is overcomplicated and not necessary. We can systematically plot attractive submarkets across the entire country using points of interest (POI) data containing the coordinates of attractive retail chains, schools, city centers, comparable assets, and more.
Plotting Points of Interest (POIs)
A CSV file with the latitude and longitude coordinates of significant points of interest (POI’s) will comprehensively identify the pockets of population density and existing developments that our project’s future residents will want to be near. There are fantastic free datasets with nationwide coverage for this such as Foursquare’s open source POI data for retail chains or the Department of Education’s school locations dataset.
In this example, we will download the nationwide public school POI dataset as a CSV here.
With this CSV in hand, generating some Python code that reads our CSV of schools, executes a geospatial analysis, and outputs a file containing all of our submarket boundaries is easy with the help of AI. For example, open the Public_School_Characteristics_2022-23.csv, copy the header and second row of data (this will provide critical context to our AI assistant about the CSV schema), and then paste the CSV rows into an assistant like ChatGPT with a prompt like this:
Write a Python script that reads a CSV file (Public_School_Characteristics_2022-23.csv) containing school location data. The script will:
Select only schools located in Tennessee.
Create a 5-mile area (buffer) around each school’s location.
Combine all buffered areas into one GeoJSON file (submarkets.geojson).
To run the Python code that ChatGPT returns, we will paste it into a new file we create in an IDE like VS Code or Cursor where the code can be executed. If we need help with this, ask AI. Once the script finishes, we can visualize the outputted submarkets.geojson file in kepler.gl (a free, web-based map tool) or Felt (another web-based map tool with a free plan) to see the 5-mile submarket boundaries drawn around all of the schools in Tennessee.

Why Use Points of Interest (POIs)?
Being driving-distance from a Walmart, school, and/or a comparable asset is a very simple way to ensure the basic feasibility of an area. A single POI can automatically answer a dense set of otherwise time-consuming research questions. For instance:
Is there utility access nearby? If the site is close to retail, schools, or comparable developments—which all require sewer and water service—then utility access is likely available.
Is the area desirable for future residents? If the site is near retail and schools then we have the basic ingredients for a desirable neighborhood.
Does the area have strong rents or sale prices? If the site is near comparable assets with strong rents and home sale prices then yes.
The answers to these questions may be lower resolution at this stage, but that is okay. The purpose of this step is to make a broad, effective cut to eliminate large swaths of disqualified areas where pure agriculture or conservation uses are more likely than high-potential residential uses. The granularity of our analysis will continue to ramp up in the following steps.
Getting Advanced: Drive-Time Isochrones
Drawing 5-mile buffers around POIs is a great introduction to automated submarket identification. However, other higher-resolution approaches are also accessible at this stage with only a small amount of extra effort.
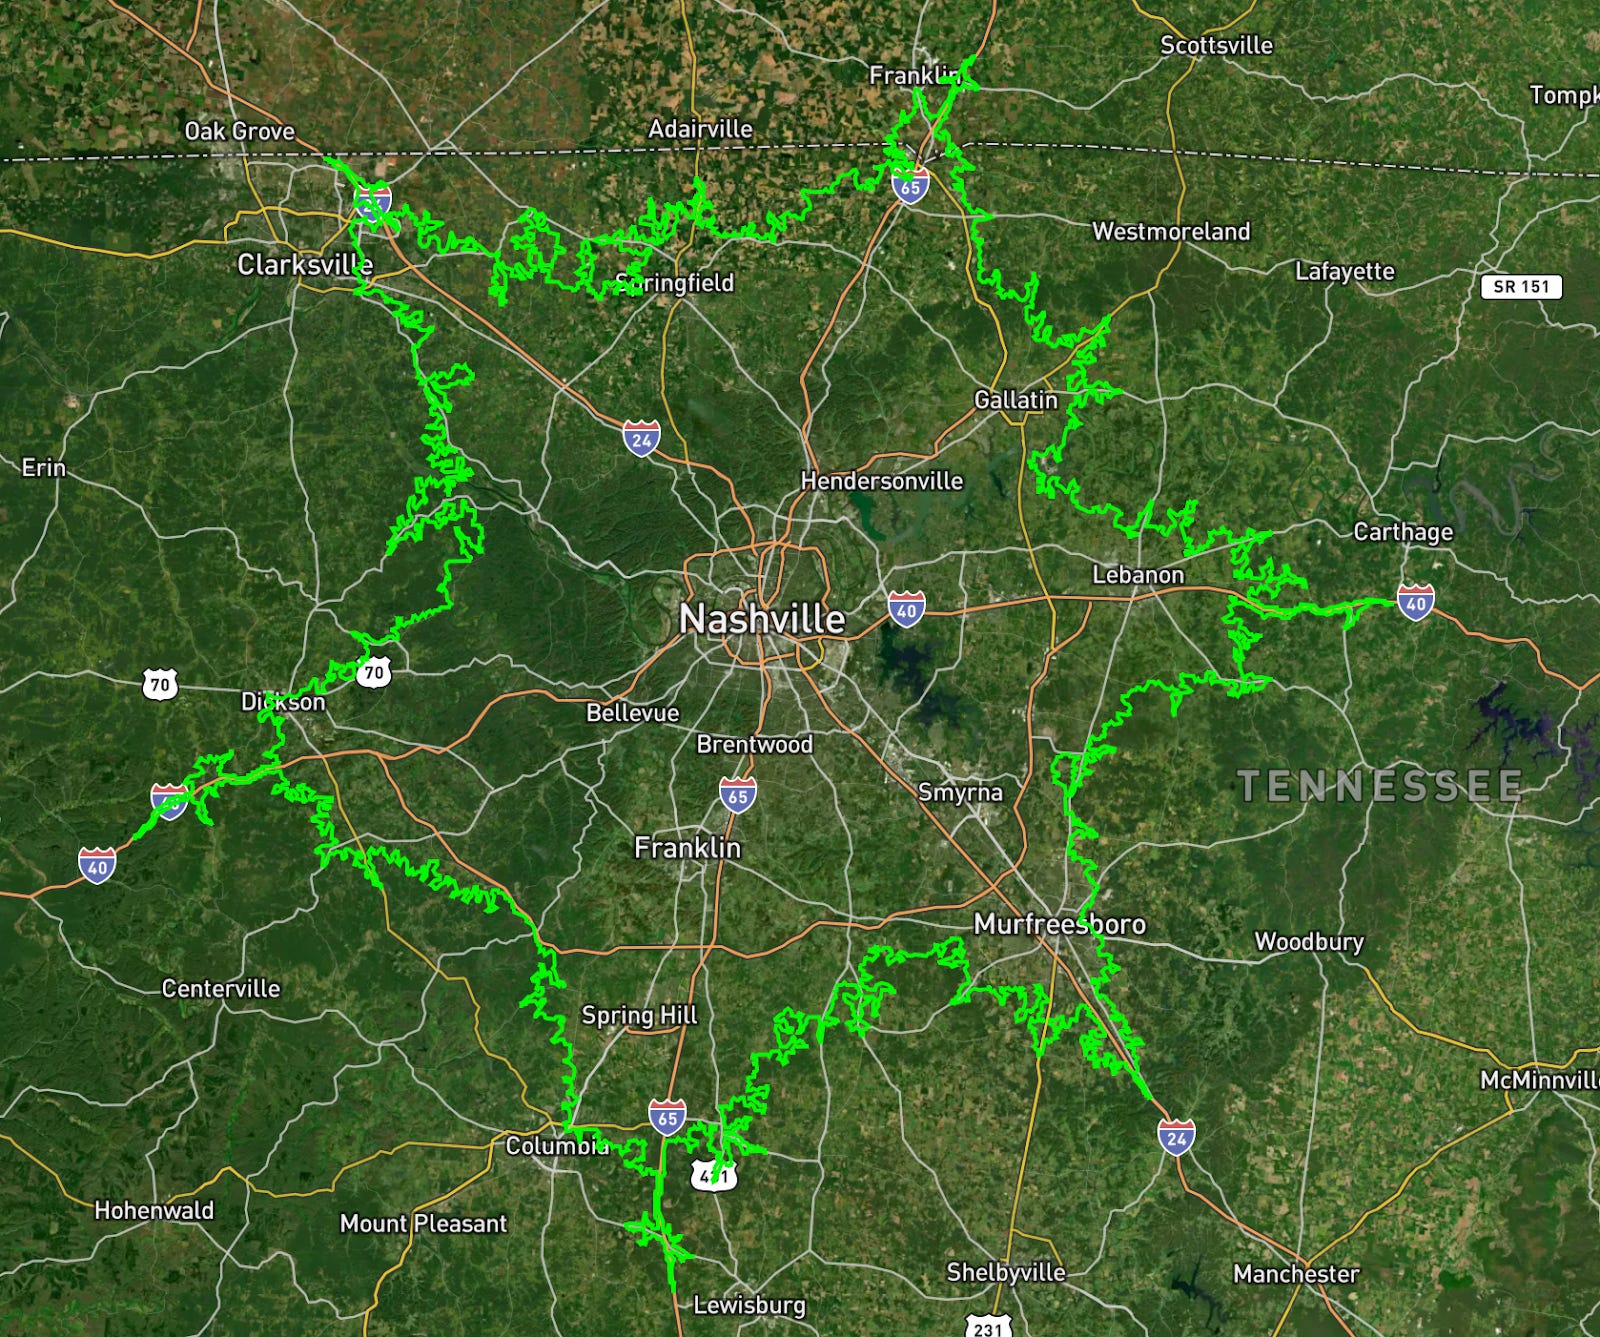
Isochrones are algorithmically calculated shapes that represent equal commute times in all distances from a central point. These shapes are used to map, for example, a 50-minute driving distance from a city center or school, which is a better reflection of reality for our future residents than a simple circular-mileage radius.
We can actually measure the difference this makes: in Nashville, a 50-minute drive can be as far as 60-miles away from the city center and as close as 30-miles. That is a big swing in distance that our simple, 5-mile buffers might miss.
Transportation infrastructure adds a more complex shape to our submarkets; however, technology still captures it with precision. And while drive-time isochrones are much more precise, they are actually not much more difficult to generate when using Mapbox’s API. Simply sign up for a Mapbox account, ask an AI assistant to generate the code for an isochrone from our desired points, and paste our API key into the script to generate a more precise submarket boundary like in the image below.
Step 2: Site Selection
With the submarket boundaries defined, we can now build an automated site selection analysis that identifies the most feasible sites within our submarkets.
Here, we will have AI write code to analyze every parcel that falls within the boundaries of our submarkets.geojson file and score its suitability for a 100+ single-family home development based on the land’s total acreage, ownership, assemblage opportunities, and topography.
Filtering for Parcels Inside of Submarkets
First, we slice our parcel data against our submarket boundaries and discard the excess parcels. This works like a cookie-cutter slicing away excess dough. We can ask AI to generate a new Python script:
Write a Python script that reads two files: a CSV file (parcels.csv) containing parcel information and a GeoJSON file (submarkets.geojson) defining area boundaries. The script will:
Check which parcels are located inside the submarket areas.
Remove any parcels smaller than 1 acre.
Save the parcels inside the submarket areas to a new CSV file (parcels_in_submarkets.csv).
It is recommended to perform this in one county first before scaling it across many. Doing this analysis across more than one county’s parcels can become computationally intensive and may require specialized software like Snowflake to leverage additional computing power outside of our machine.
Using a stronger AI model like OpenAI’s o3 or o4-mini-high, asking it to consider computational performance by using bounding boxes (a geospatial technique that splits up the processing into smaller chunks), and filtering out very small parcels that are less than one acre in size are great ways to write more efficient code and avoid crashing our computer when processing the parcel data.
Next, we will find all of the parcels and assemblages of parcels that match the minimum acreage our 100+ home project requires.
Detecting Assemblages
Assembling multiple parcels together—often owned by the same person or entity—is the type of opportunity that is difficult to identify with the naked eye. That difficulty is precisely why great deals are often formed via assemblages.
Thankfully, we can apply Python logic against the standardized parcel data to identify the parcels near each other with common owner names and/or mailing addresses:
Write a Python script that reads one CSV file (parcels.csv) containing information about land parcels, including owner names, mailing addresses, parcel size (acres), and parcel shapes (geometries).
The script will:
Group parcels if they share the same owner or mailing address and are physically close to each other (within 20 meters).
Calculate the total size (in acres) of each group.
Keep only groups whose combined size is at least 20 acres.
The results will be saved in a new CSV file (qualified_clusters.csv).

Notably, the majority of opportunities (300 out of 400) in Rutherford County, TN are assemblages. The minority of opportunities are the standalone parcels of 20 acres or larger. Additionally, we have actually excluded any assemblages that involve two or more owners. Which means there are more possible assemblages to be found if we opened our parameters to allow for that. But, we will skip those opportunities for now because of the added complexity that forming a deal across multiple landowners can bring.
Now, with our list of the land opportunities large enough for a 100+ home project, we can cut a layer deeper by eliminating land owned by entities that are unlikely to sell.
Disqualifying Land Owners With AI
The most common land owners with a low propensity to sell are government entities, but they can extend to include HOAs, cemeteries, mines, waste facilities, and more. Here, we can use AI to focus our results entirely on land owned by individuals and companies that do not fall into the above list of disqualified owner categories.
At this stage, have a relatively small CSV containing hundreds of possible parcels. So, we can make our analysis simple by dropping our CSV into ChatGPT and using a prompt like:
Read each row in the uploaded CSV file of parcel information and
Identify if each row’s owner name indicates:
A government entity
A homeowner’s association
A cemetery
A mine
A waste facility
Add a new column called “Is Owner Qualified?”:
Mark “No” if the owner matches any of the types above.
Otherwise, mark “Yes”.
Save the updated data back into the CSV file.
This will output a spreadsheet that we can filter to eliminate disqualified owners across the many, differently named entities that local cities, counties, and states create - from boards of education to housing authorities. This approach is also completely customizable. Simply tweak the prompt to describe any category of ownership that is undesirable and check that our results match our expectations.
At this stage, this list of parcels has been distilled to only a few hundred qualified opportunities. Sending mail to all of the owners now and concerning ourselves with more detailed due diligence on the topography later is possible. But, with one last push we can leverage the technology to weed out dealbreakers like floodplains and wetlands to avoid exhausting our own time and resources disqualifying land when owners start calling us back.
Getting Advanced: Calculating Buildable Acreage
Determining whether a parcel has any deal breaking topography issues starts with understanding its buildable acreage.
Understanding buildable acreage requires analyzing the overlap of many data points against our parcel data including wetlands, FEMA Floodplains, slope, soil type, parcel shape, current use, zoning, and more. Defining a universal buildable acreage algorithm is beyond the scope of this letter. However, we can begin to solve this problem by addressing wetlands, floodplain, and current land use.
Here we will use the National Wetlands Inventory dataset and slice it against our parcels. We can tell AI:
Write a Python script that reads two files: a CSV file (parcels.csv) containing parcel information and a GeoJSON file (wetlands.geojson) containing wetland areas. The script will:
Calculate how much of each parcel overlaps with wetlands.
Add 2 columns that determine the following acreages for each parcel:
Acres covered by wetlands.
Acres not covered by wetlands.
Save the results to a new CSV file (parcels_with_wetlands.csv).

Step 3: Owner Outreach
With a bulk list of 300+ target sites identified, we can now begin outreach and build our pipeline.
Our CSV of parcels can be inserted into an automated mail platform like Postgrid or Postalytics, and with some effort choosing a letter template and matching our CSV to their standards, we are off to the races. We just successfully contacted owners for 300+ highly qualified land opportunities and built a repeatable system of analysis that is ready to deploy across other markets on command.
Repurposing Across Asset Classes
While the focus of today’s letter was on finding land for a single-family development, the workflows described are adaptable to other asset classes. With modification, effective automations like this can be deployed across asset classes like multifamily (where analyzing zoning becomes more important), retail (where analyzing competitors, foot traffic, and void analysis becomes important), and industrial (where analyzing transportation and utility capacity become more important).
Going Beyond Land Analysis
Additionally, this letter touched on the applications of automation in the earliest stage of real estate development: finding land. However, the possibilities of analysis like this can extend further into the real estate development lifecycle wherein each step successively builds upon the previous. For instance, technology can now assist with designing and underwriting projects. With a comprehensive, reliable buildable acreage algorithm in place, the automations described in this letter establish a foundation for applying downstream automations using tools like Giraffe and TestFit to generate site plans and underwriting models.
As public data becomes more accessible and software becomes more capable, it is increasingly clear that land analysis–and possibly other aspects of real estate development–can be engineered into a repeatable, scalable system.
—Dylan Goren
 | A guest post by
|
Important tech for land developers Dylan Goren!