
Special Edition: Realpage Cuts Off EliseAI
Multifamily operators in the lurch; have the PMS wars begun?
Multifamily operators in the lurch; have the PMS wars begun?

Small-balance residential bridge loans are a bright spot for private credit

A quarterly read on early-stage feasibility activity with our friends at TestFit

Before a developer buys a site, they test it. Over the past several years, a new generation of feasibility analysis tools has made it far easier for developers to get a quick understanding of what can (or cannot) be built on any given site without dozens of hours of upfront architectural work and financial analysis.
All those feasibility studies produce something special: data on what developers are analyzing today.
TestFit, which has been the leading automated feasibility analysis platform for more than a decade, ran roughly 123,000 site analyses last quarter. So we’ve partnered with them to explore their aggregated data as a signal of where real estate development is headed, from density and parking trends to in- and out-of-favor asset classes. This will be an ongoing quarterly series tracking feasibility data longitudinally over time.
Note that this is feasibility activity, not construction starts. A rise in retail feasibility indicates where developers are looking, not where ground is breaking, and the data is best read as a leading indicator of attention. What follows are seven trends from the most recent quarters.
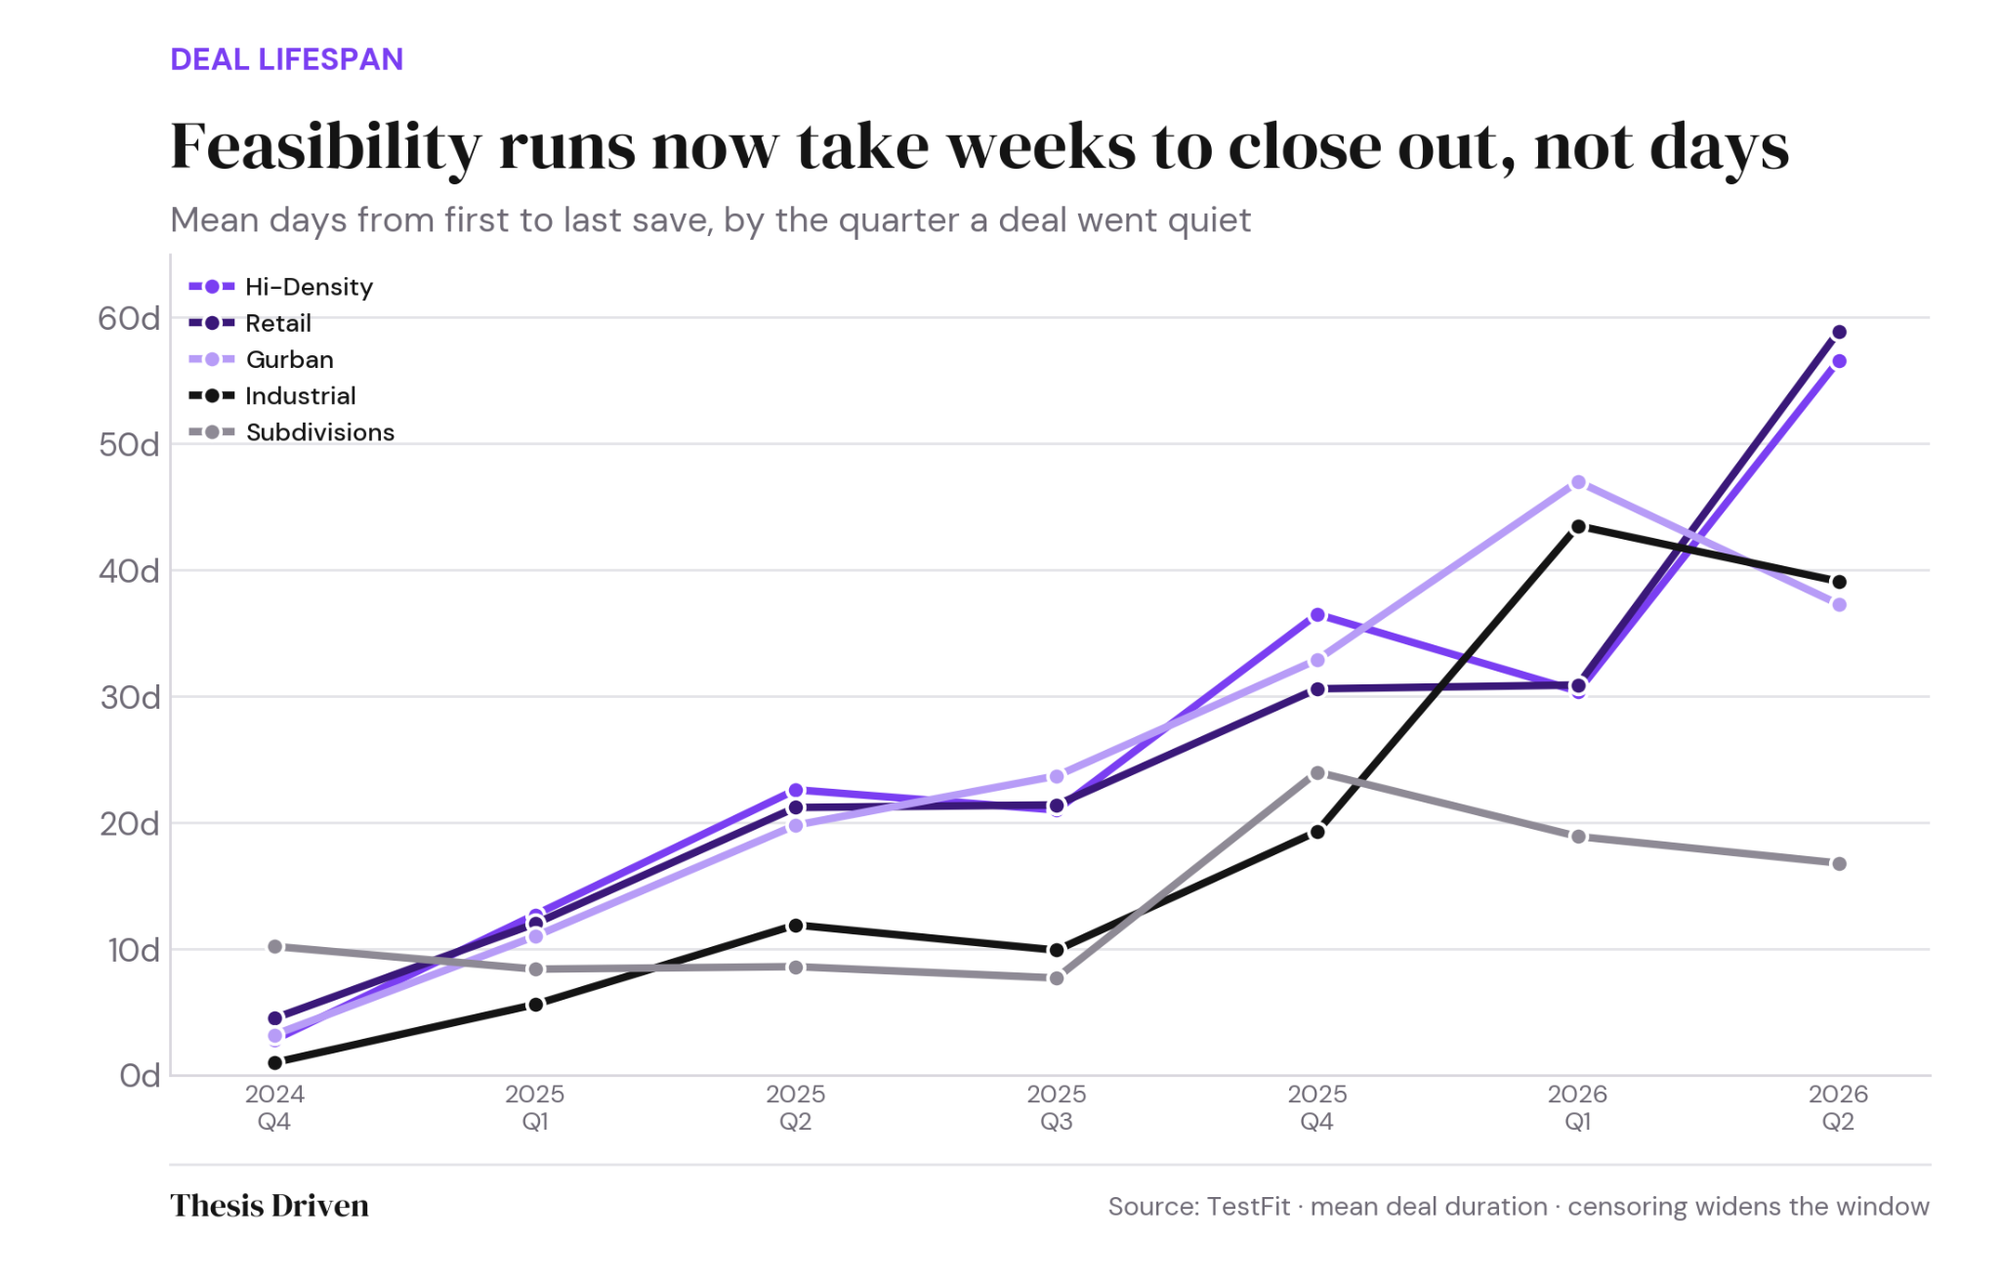
Start with the finding every developer will recognize in their gut. A higher-density multifamily deal that wrapped in Q4 2024 ran a mean of 2.8 days from first save to last. A year later, the same kind of deal ran 30.4 days, close to an elevenfold increase; retail stretched from 4.5 days to 30.9 days, and industrial went from a single day to 43 days.
And Q2 2026 pushed these figures higher still. Retail deals wrapping last quarter sat idle for a mean of 58.9 days between first and last save, and higher-density multifamily crossed 56 days for the first time.
Mean active days, the days a user actually touched the file, roughly doubled over the same period, while total duration grew eight to ten times. The gap between those two numbers is the whole story. Deals are not absorbing more work but instead sitting idle between bursts of it, which explains why duration is growing so much faster than active time. They’re getting picked up, re-penciled, and put back down weeks or months later.
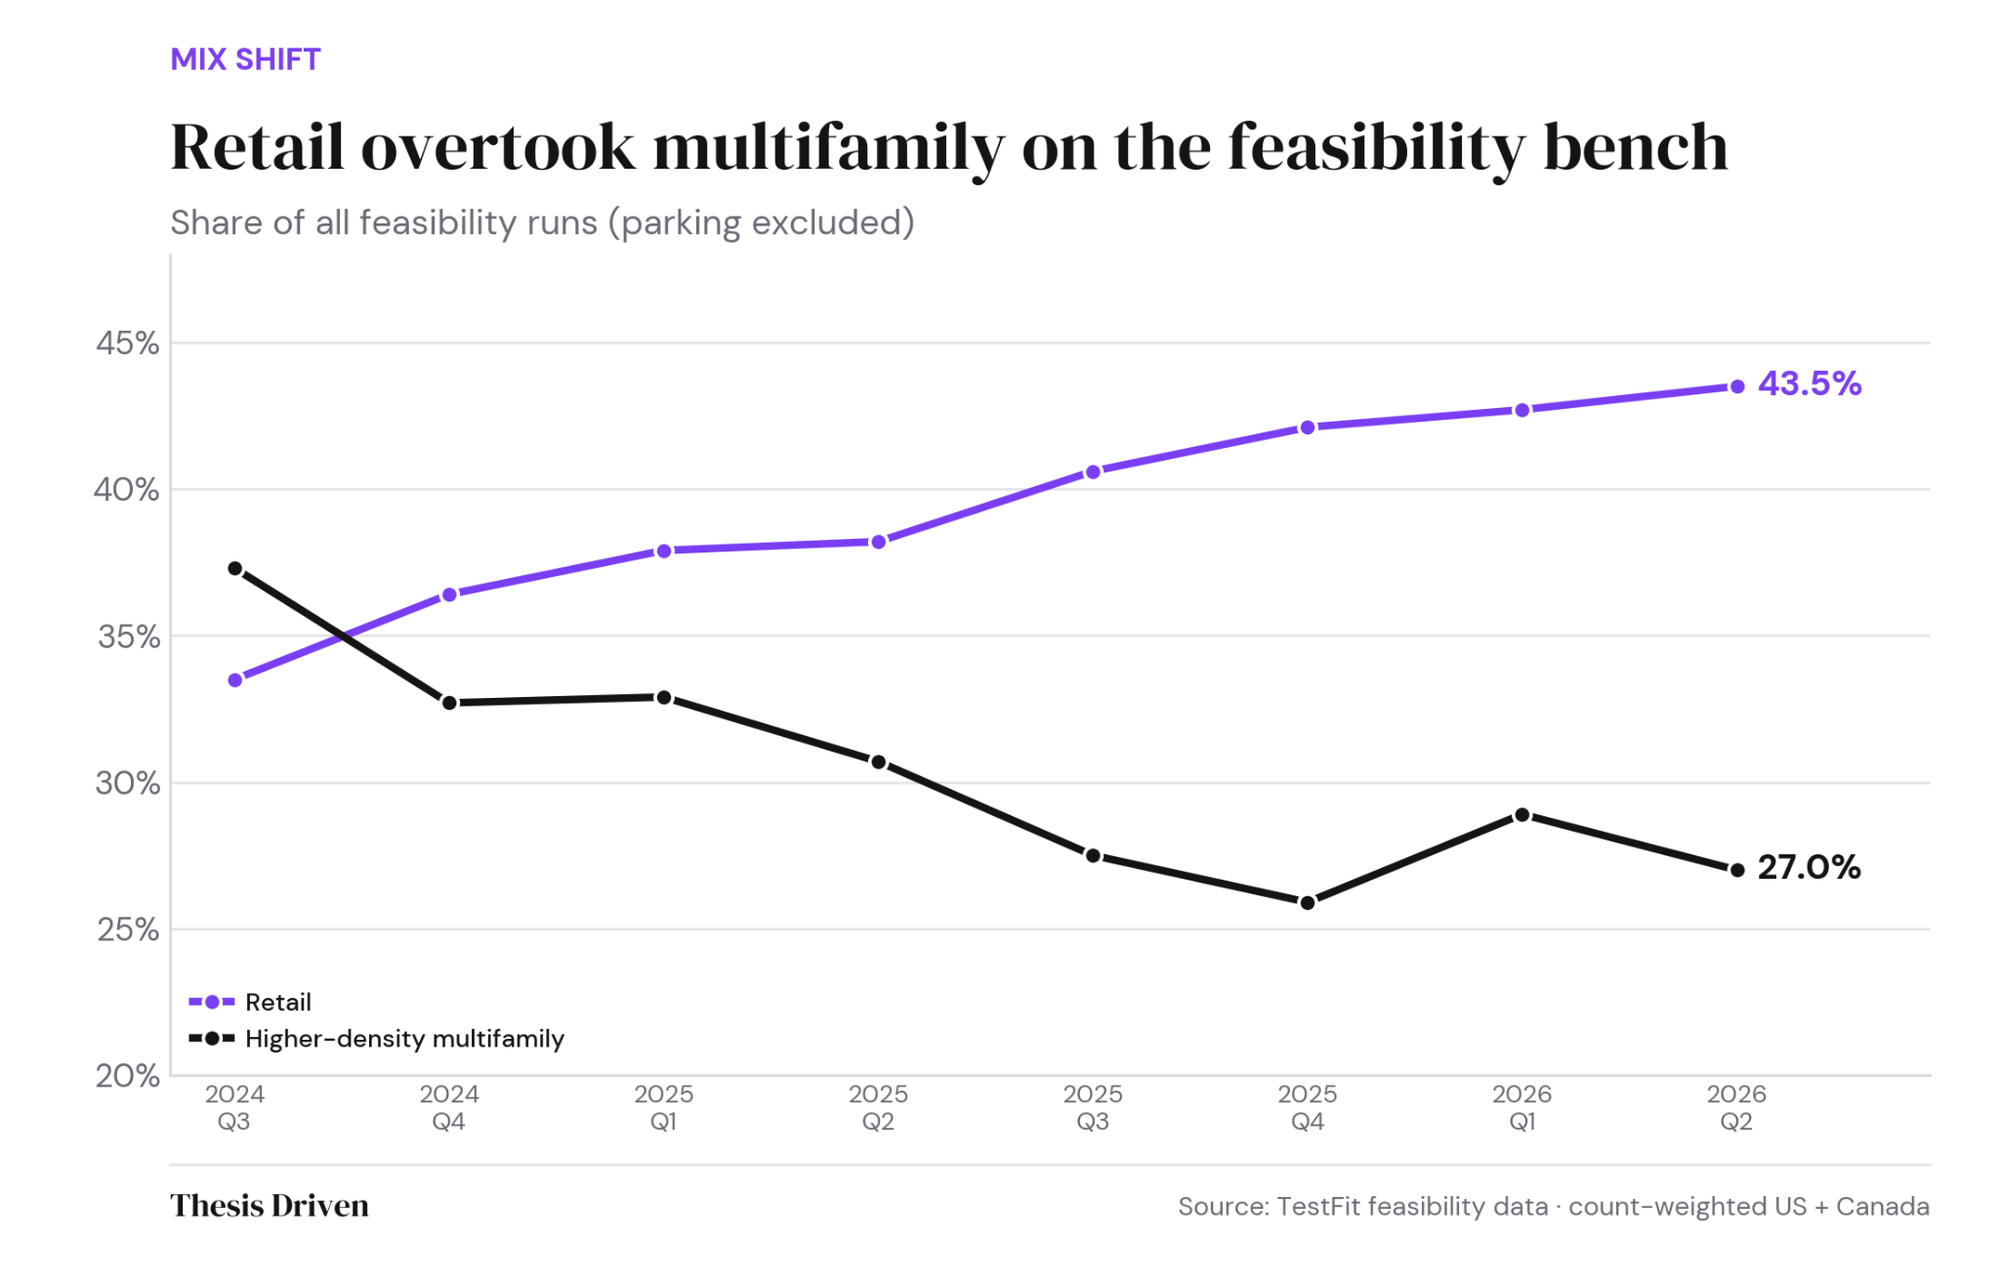
Strip out parking, which TestFit began tracking in late 2025, and there is a clear shift in the asset classes drawing developers’ attention. Retail's share of all feasibility runs climbed from 33.5 percent in Q3 2024 to 42.9 percent in Q1 2026. Higher-density multifamily went the other way, from 37.3 percent down to 28.5 percent.
A year ago, the single most common building type a developer stress-tested on the platform was an apartment building; today it is a retail box. Capital is aggressively hunting grocery-anchored centers, junior boxes, and infill pads, and this shows up in the feasibility analyses being run. Multifamily is not dead, but it has lost the top spot.
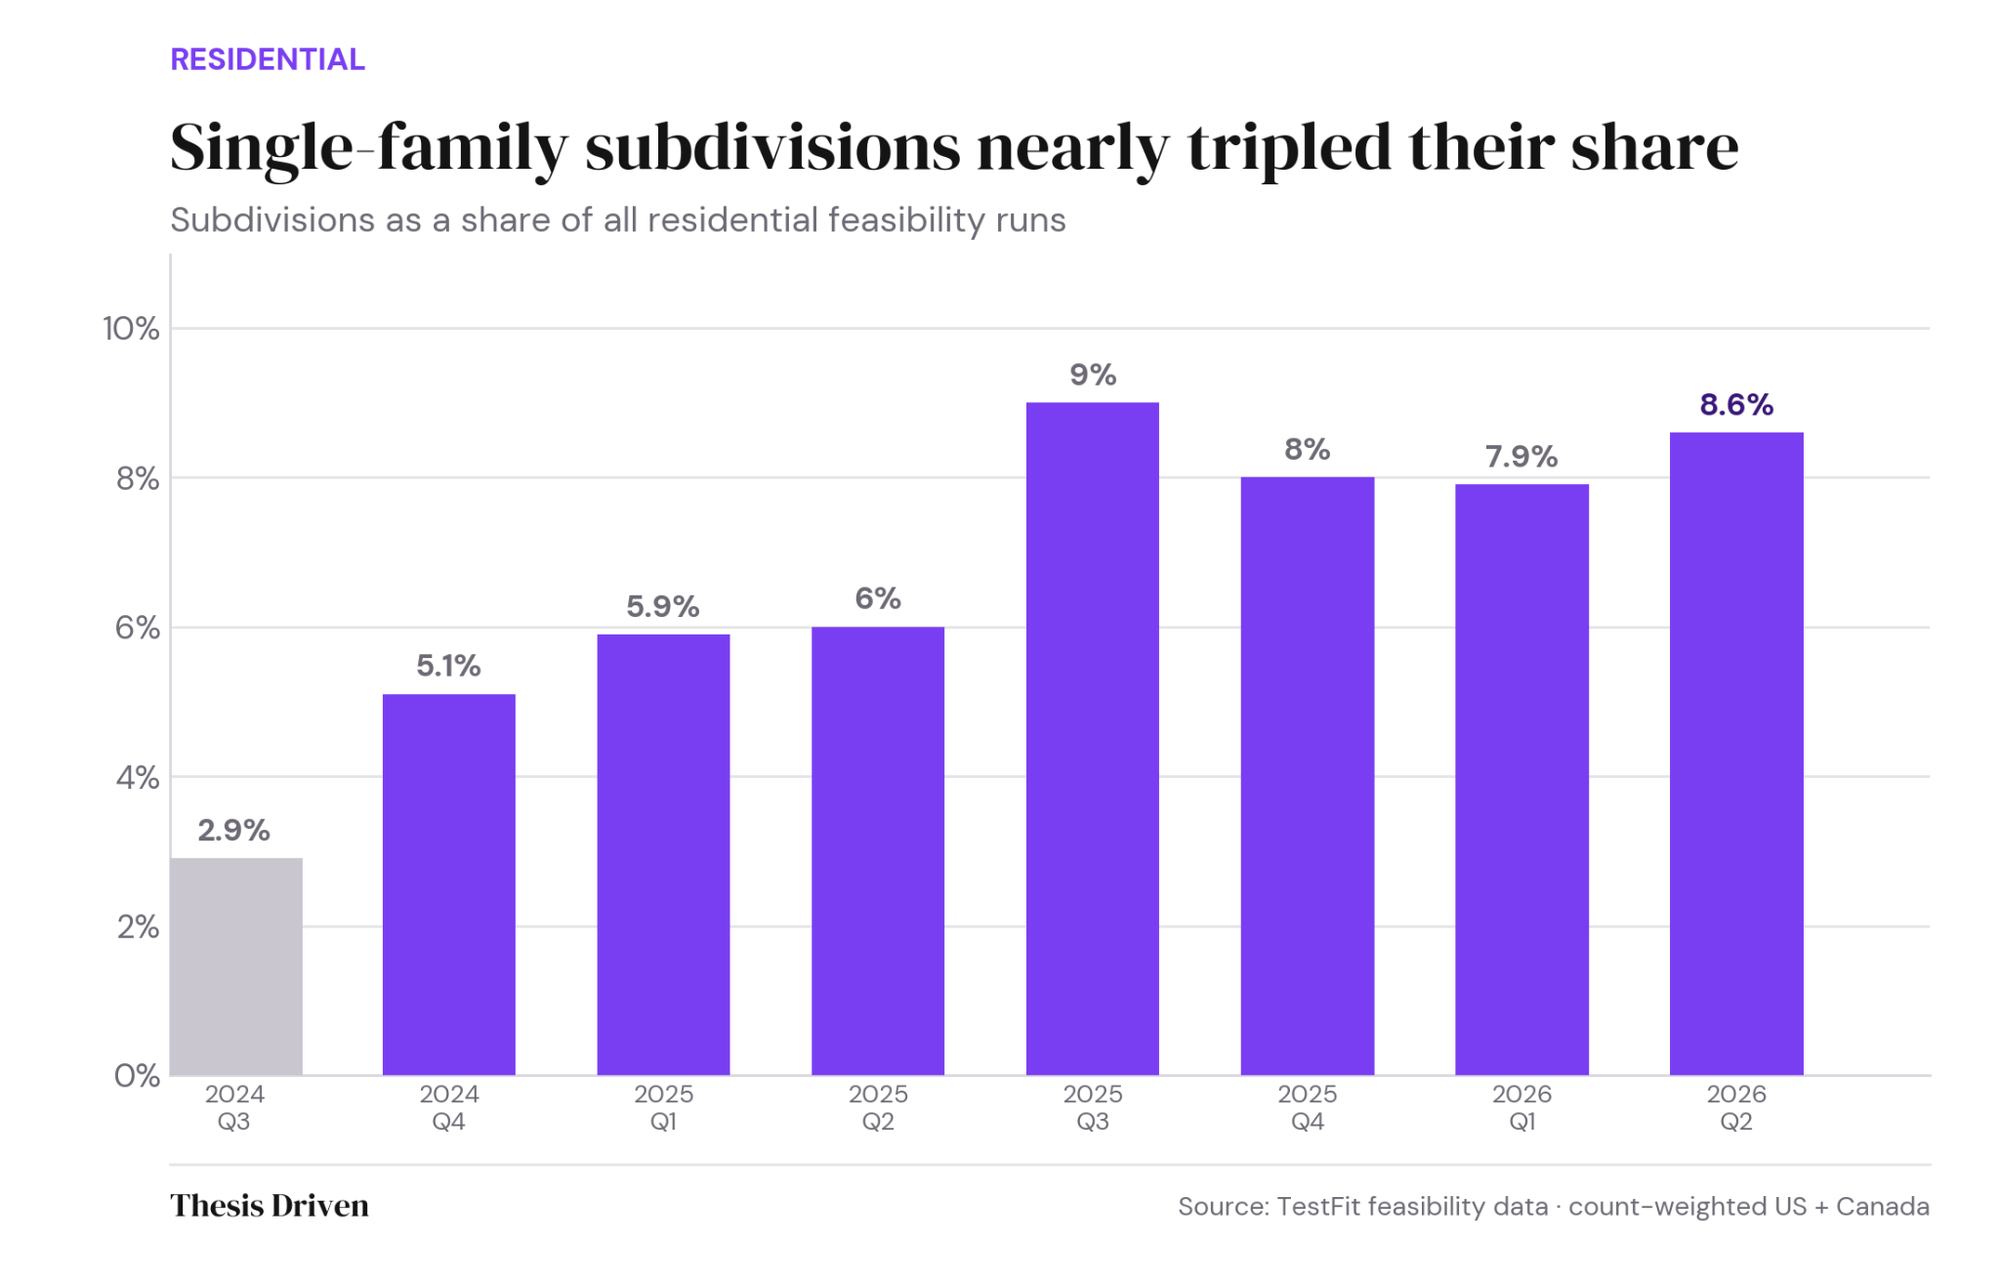
Within residential typologies, the subdivision is the fastest-growing category on the platform. Its share of residential feasibility runs rose from 2.9 percent to 8.6 percent over the past two years. The median subdivision tested at roughly 27 acres, 50 units, and 24 dwelling units per acre. But there’s geographic concentration in the sample: Phoenix and the Washington, DC, area now account for roughly 20 percent apiece of every subdivision feasibility run in the country, a striking concentration of the horizontal-residential thesis in two specific metros.
The build-to-rent and horizontal-apartment thesis is showing up in raw pencil data, well before it surfaces in the NCREIF index. Single-family rental has graduated from a niche strategy to a default residential option developers reach for when the apartment math stops working.
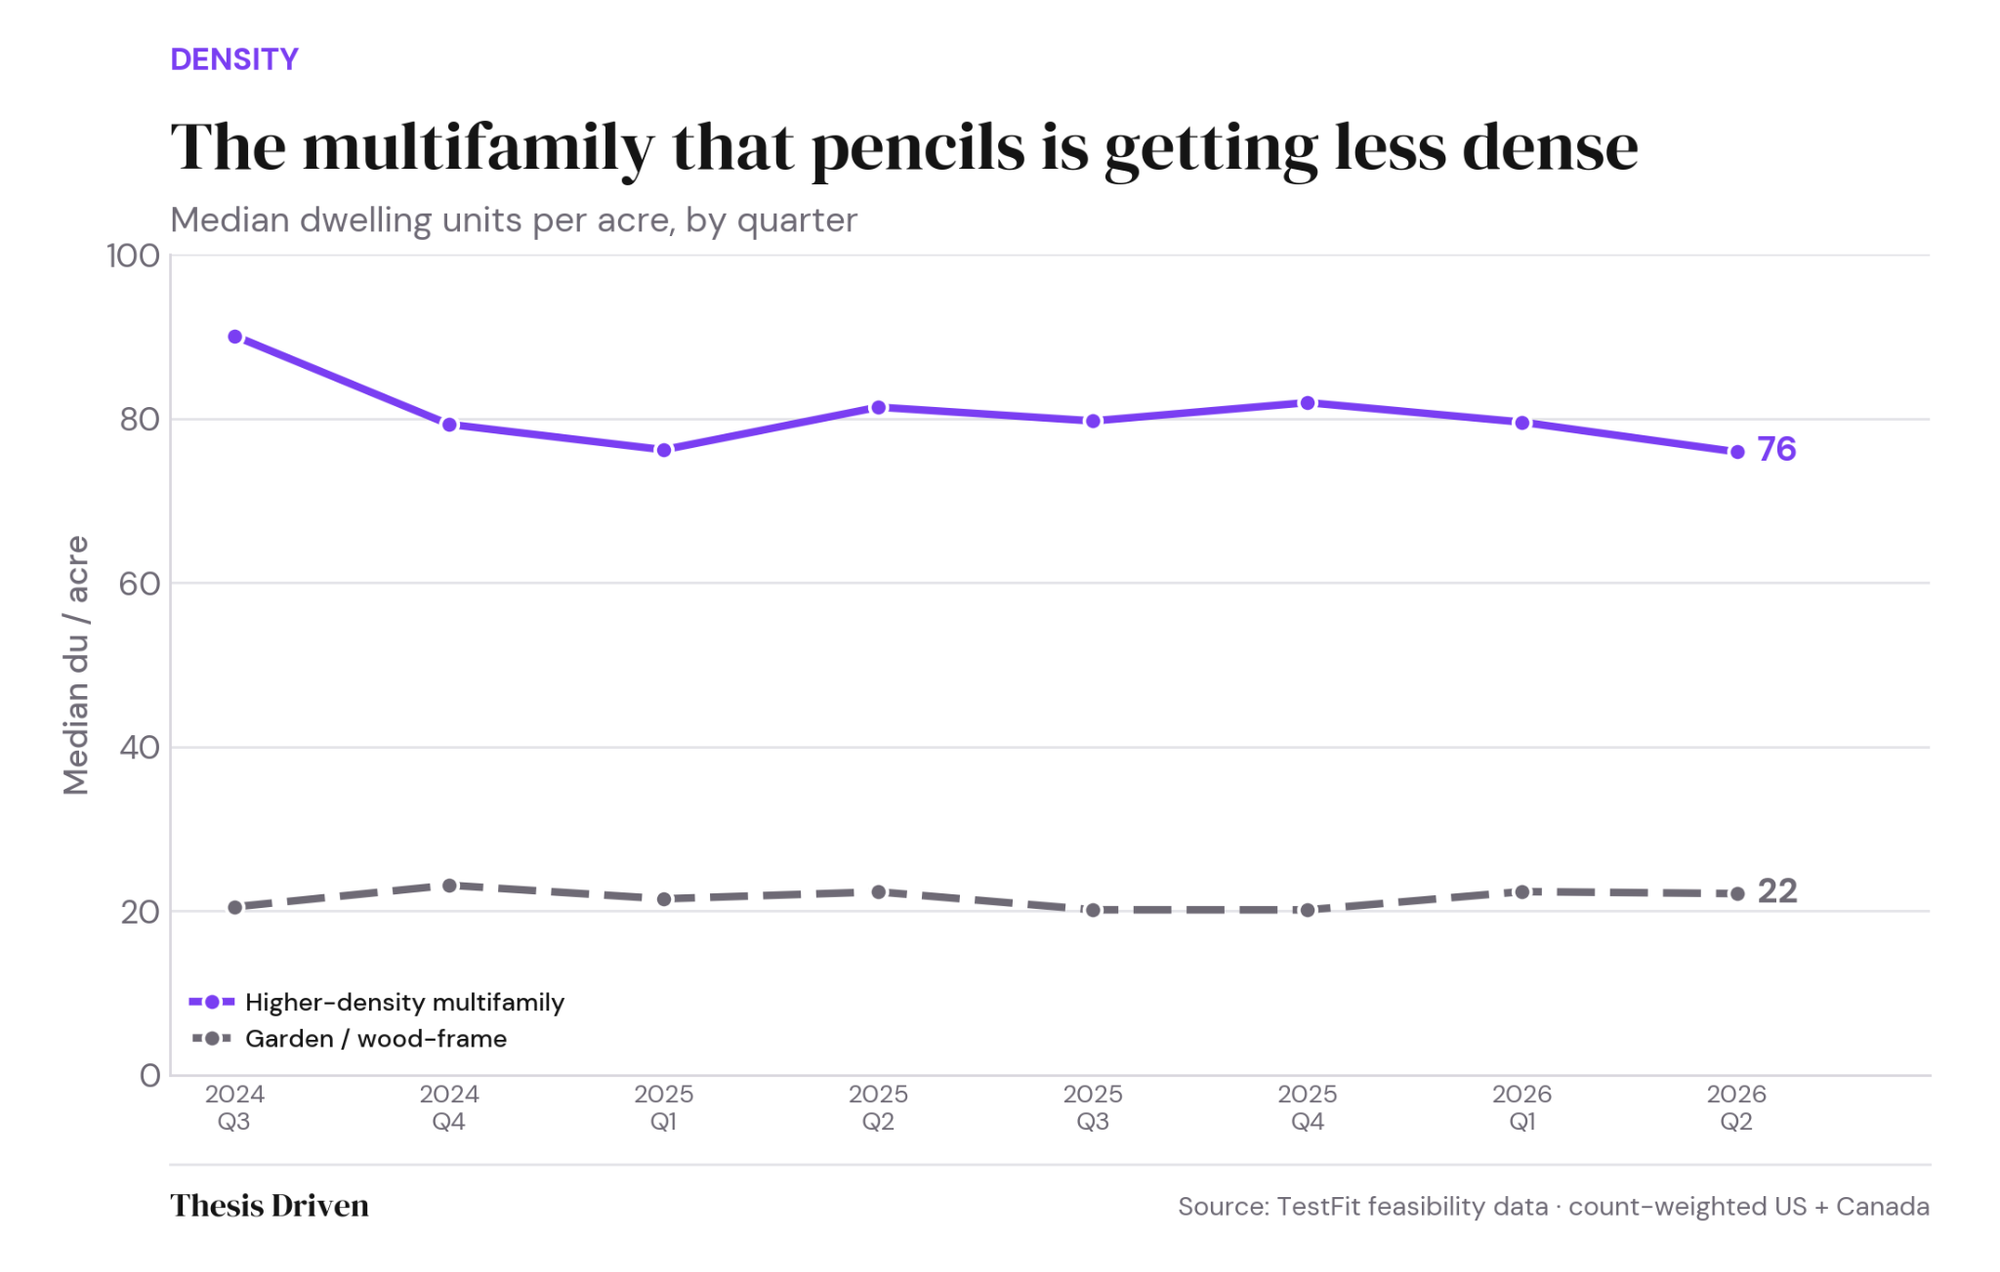
The apartments developers do test are quietly shrinking their ambition. Median density for higher-density multifamily fell from 90.2 dwelling units per acre (du/ac) in Q3 2024 to 75.9 in Q2 2026, a 16 percent drop on the same kinds of parcels.
Garden product bucks the trend, holding steady near 22 du/ac while higher-density product retreated. At construction-loan rates north of 7 percent, every additional floor of Type I podium concrete has to clear a higher bar, and fewer of them do. Wood-frame, mid-density product is where the underwriting still works, so that is where developers are migrating.
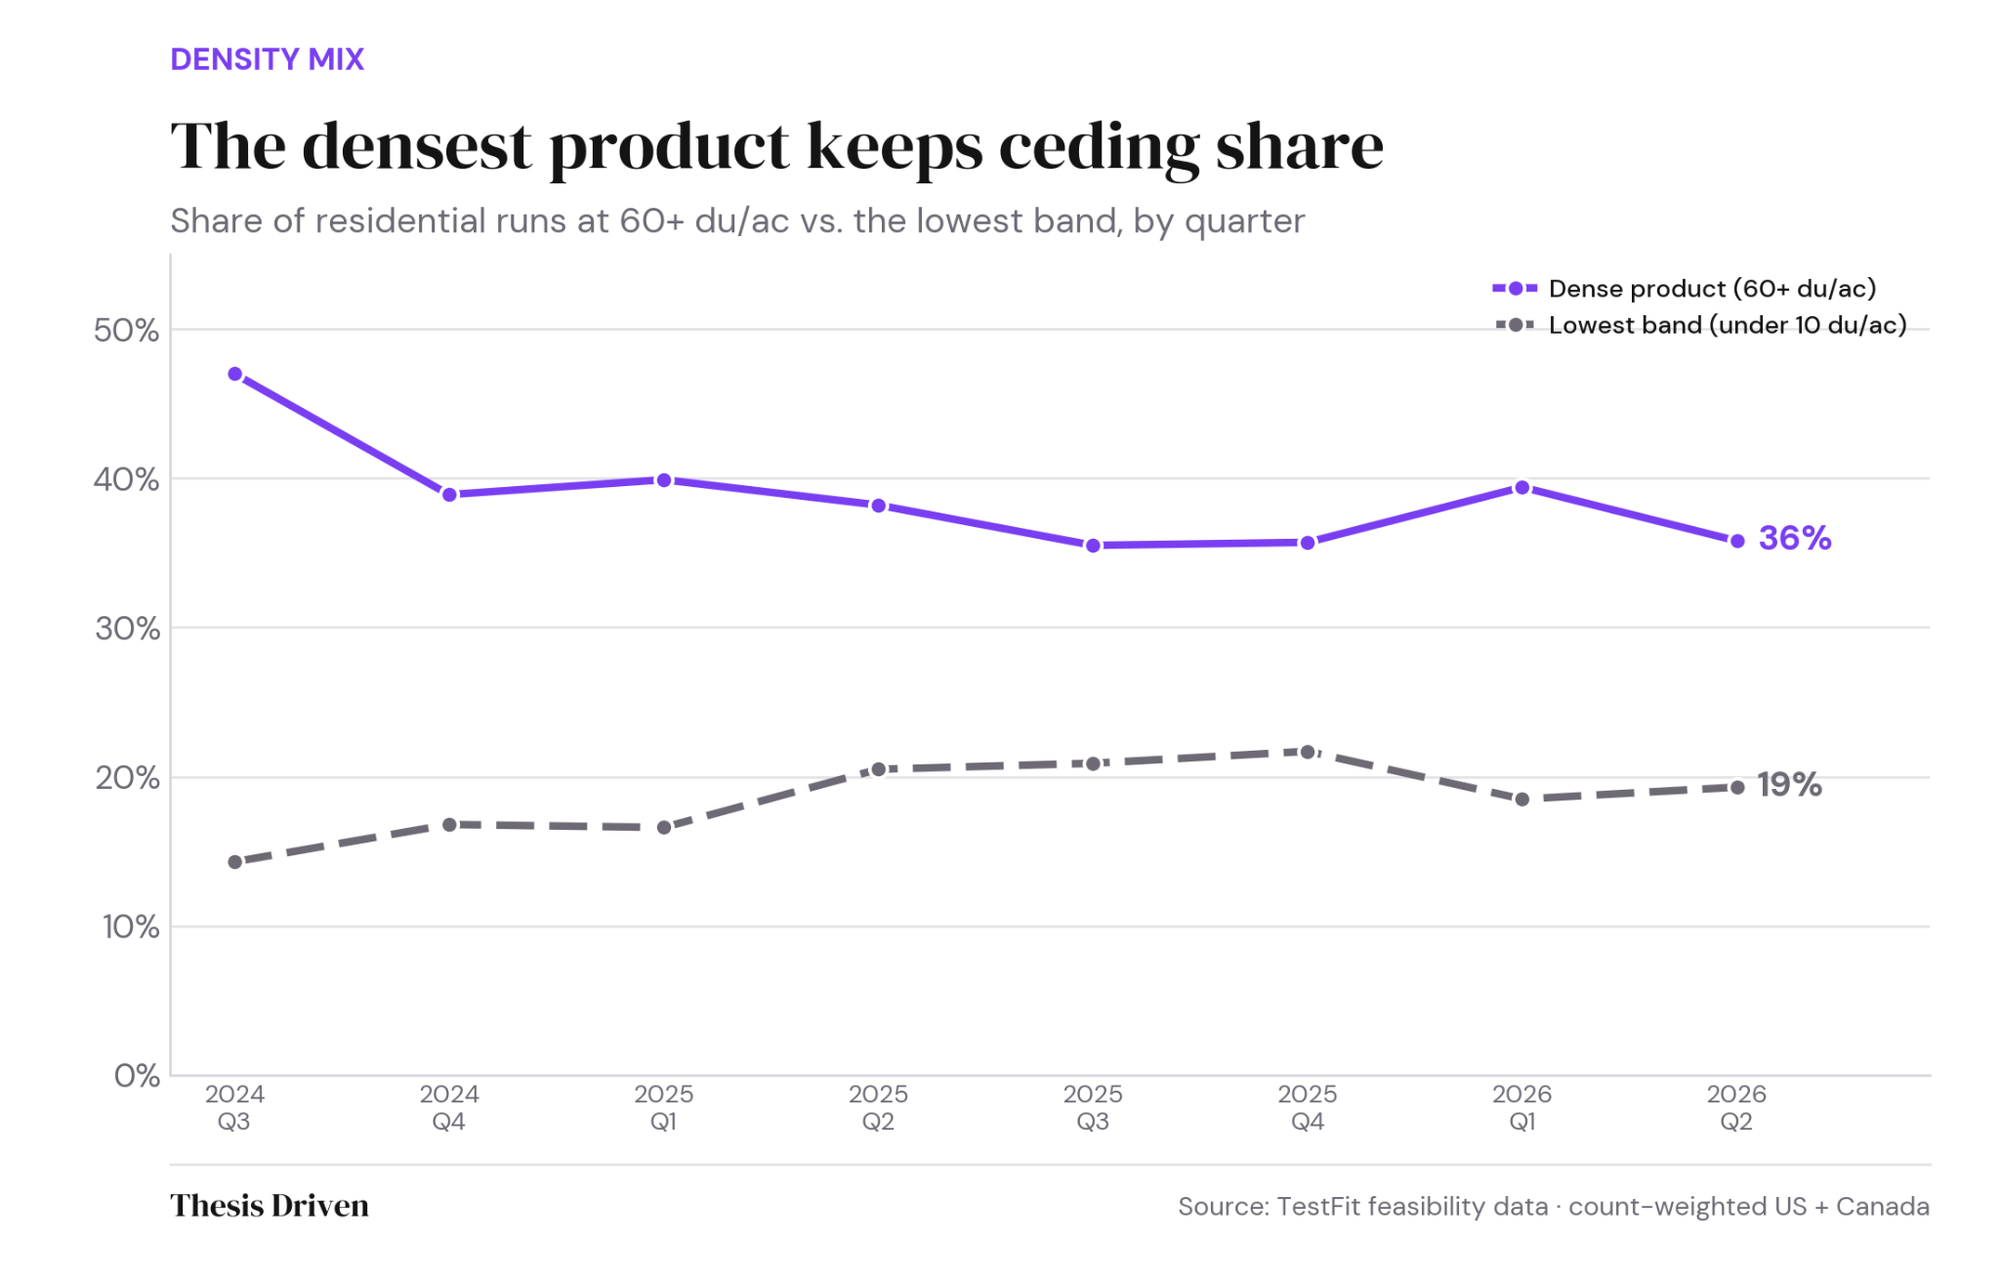
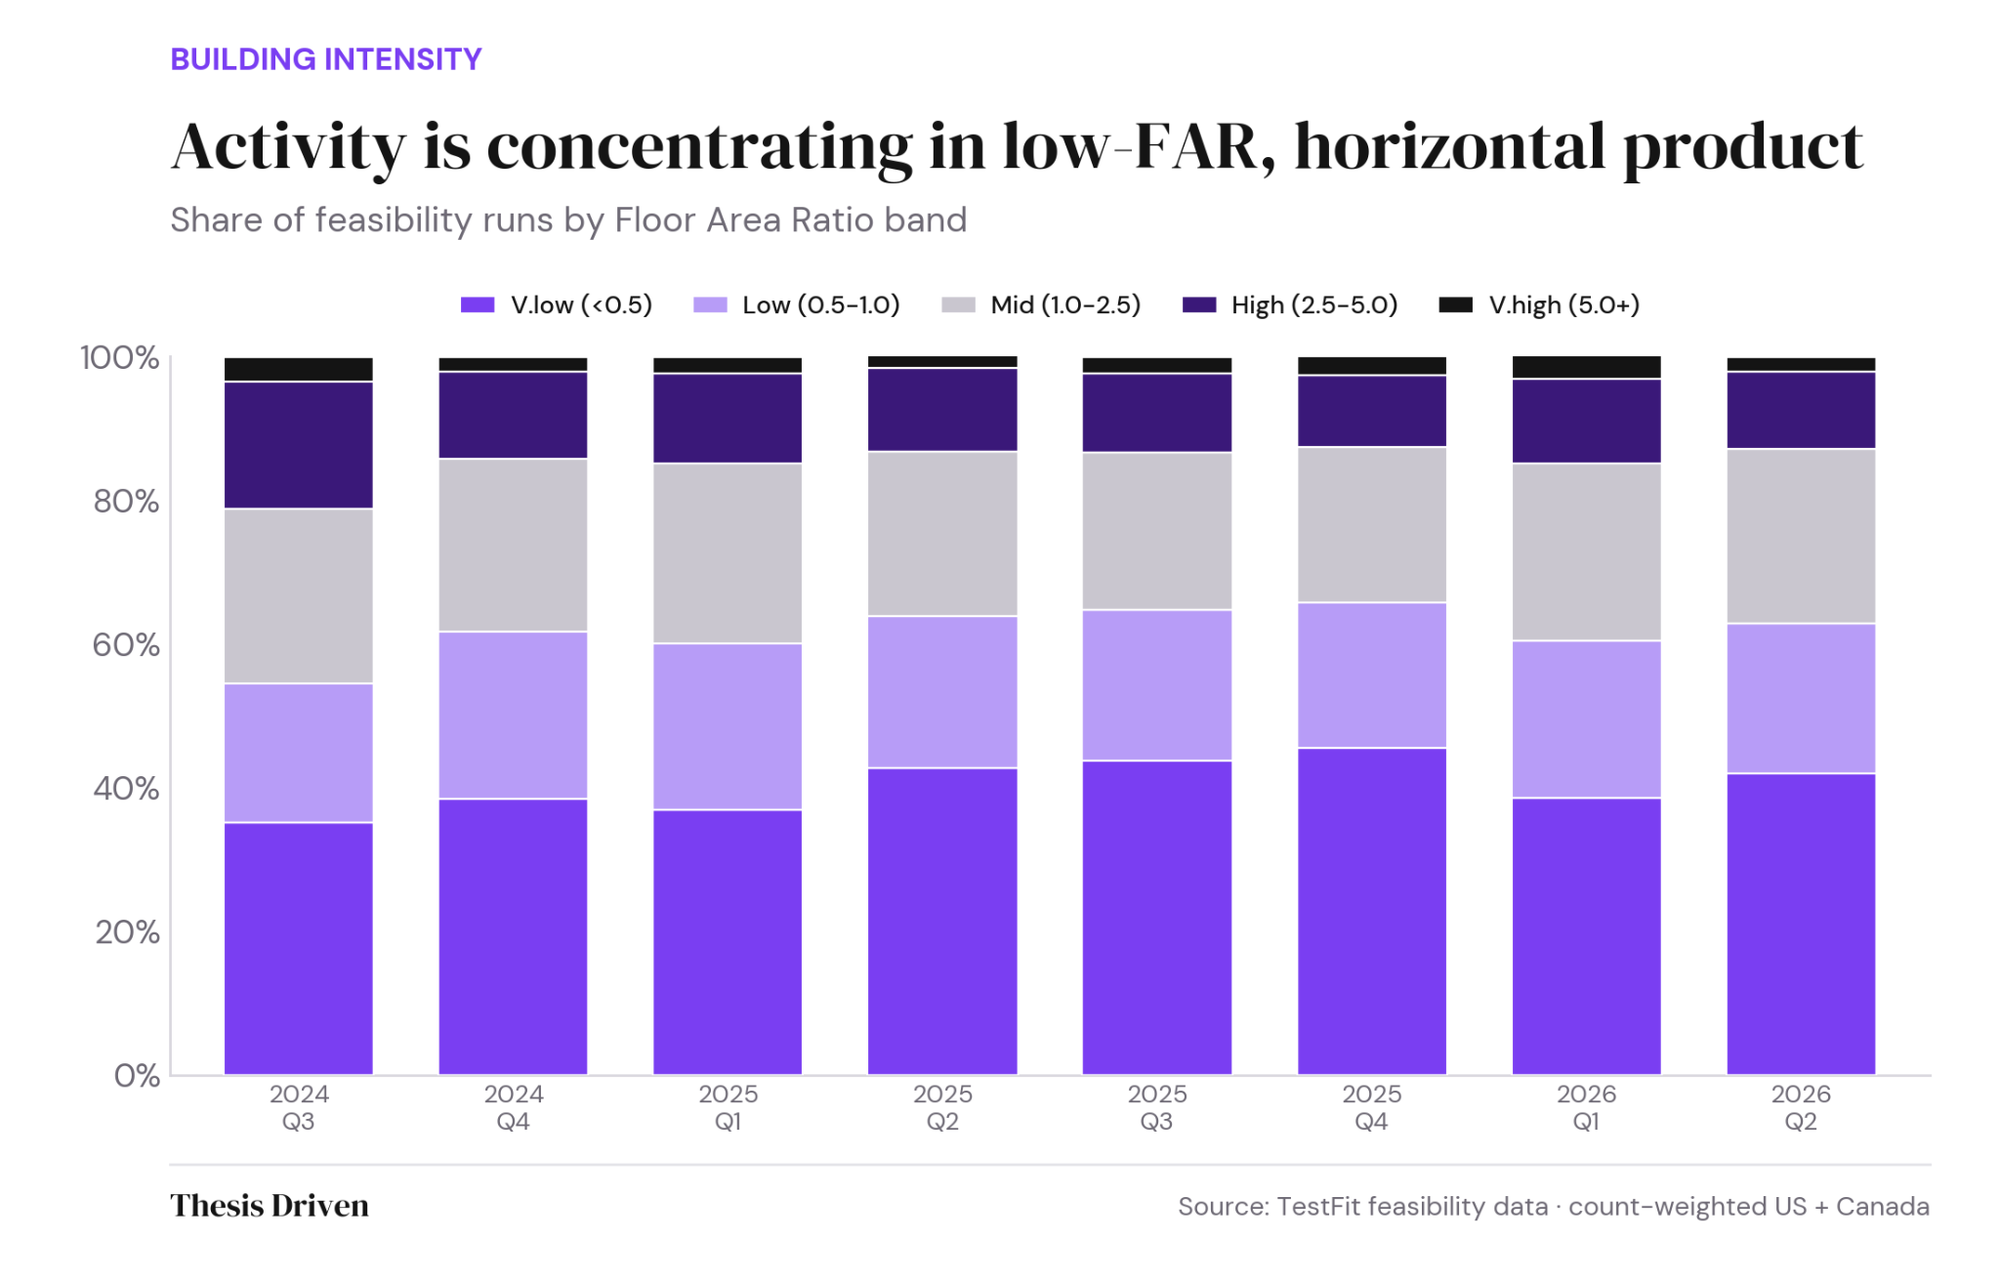
Two different cuts of the data tell one story. By Floor Area Ratio, the lowest-intensity band, projects under 0.5 FAR, grew from 35.3 percent of activity in Q3 2024 to a peak of 44.7 percent a year later before settling near 40 percent. High-FAR product, the 2.5–5.0 band, shrank from 17.7 percent to 11.0 percent. By density, the two densest residential bands combined, everything above 60 du/ac, slipped from 47 percent of runs to 36 percent, while the lowest band rose into 2024 and then flattened.
Dense, vertical product is ceding ground to lower-FAR, lower-density, more horizontal product. The drivers are the same ones bending the multifamily density curve: hard costs, construction debt, and a yield environment that no longer rewards height the way it did in 2021.
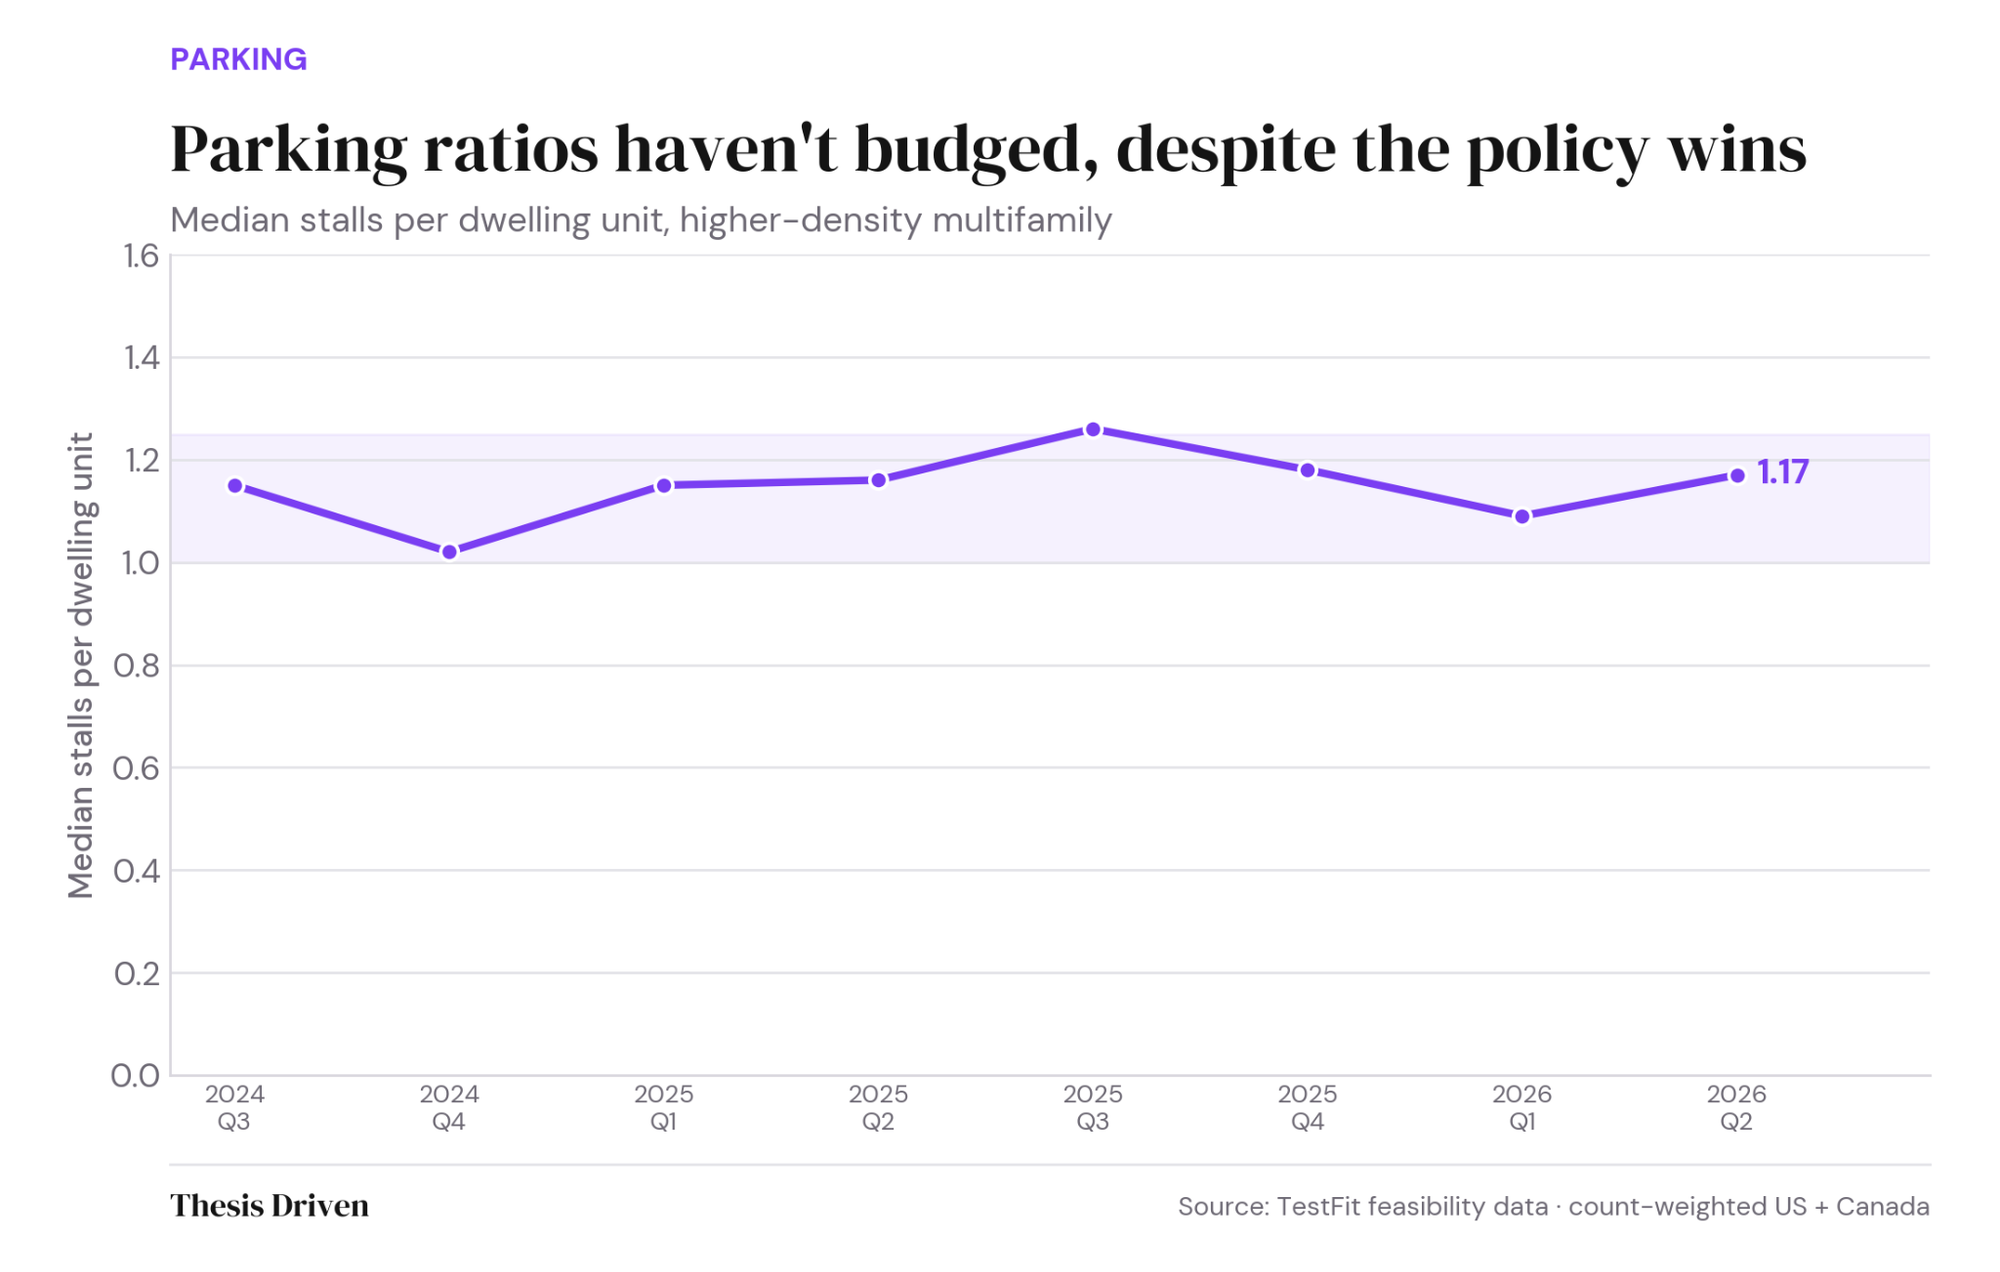
For all the policy momentum behind eliminating parking minimums, the underwriting has not budged. Median stalls per dwelling unit for higher-density multifamily has landed between 1.02 and 1.26 across the entire 24-month window, sitting between 1.08 and 1.17 across recent quarters with no clear directional shift.
As lower-density multifamily projects gain market share, parking expectations will rise, and developers are designing for what the lender and the renter still expect regardless of what the code now allows. The urbanist victory on paper has not become a design assumption in practice.
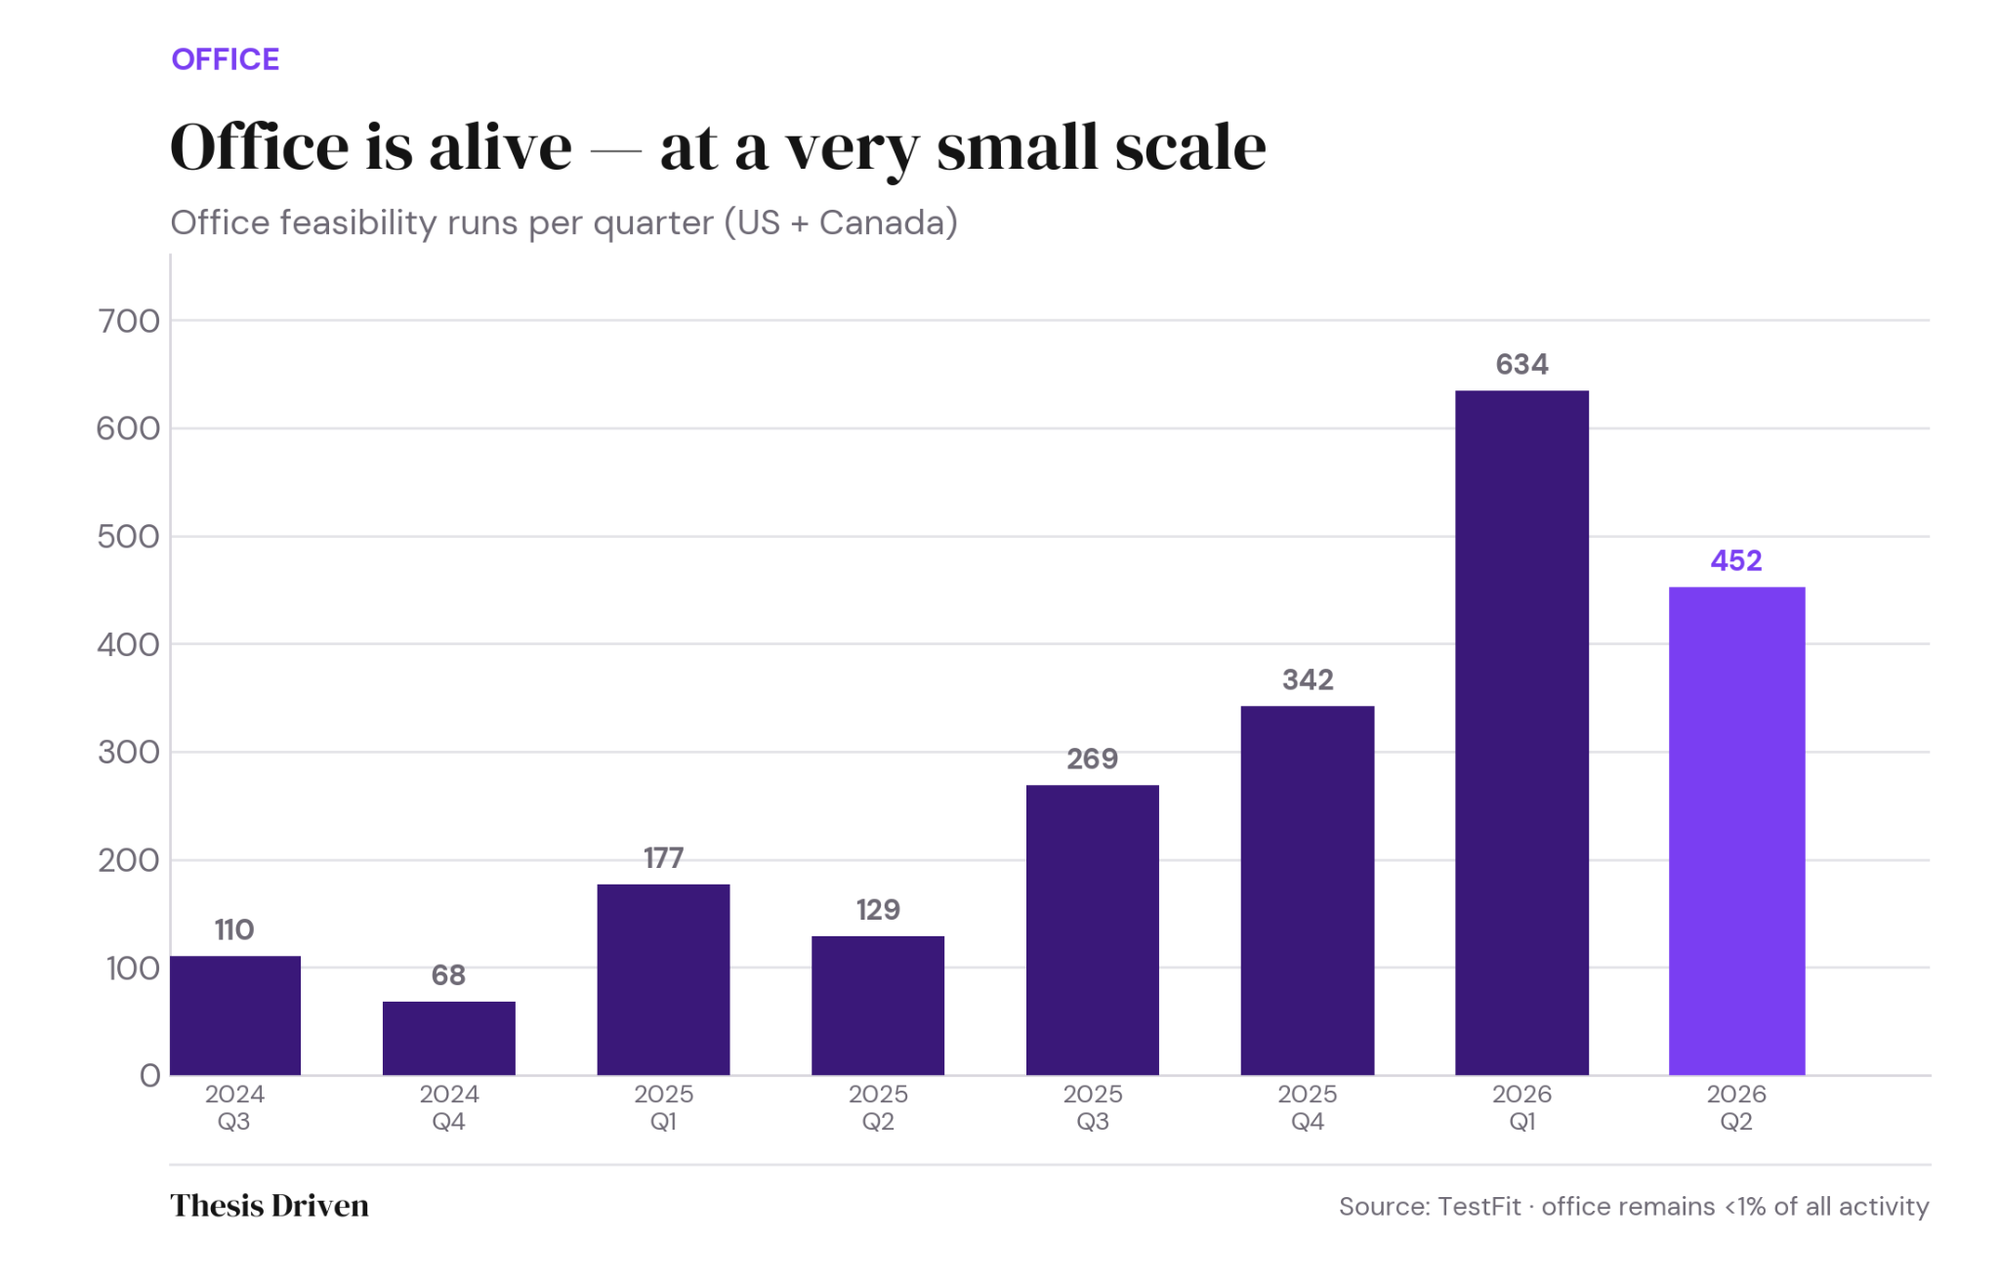
Feasibility runs for office jumped from 110 in Q3 2024 to a peak of 634 in Q1 2026 before easing back to 452 in Q2 2026. The trajectory is still positive, but the last quarter is a reminder that office remains volatile and small. The catch is the denominator: office still accounts for well under 1 percent of all activity on TestFit’s platform.
Where the office work is happening is perhaps the more interesting story. The handful of markets that still pencil are mid-tier southeastern cities including Charlotte, Raleigh, and Richmond, not the coastal gateways that defined the last cycle. The office recovery, such as it is, is a regional story about a few specific downtowns rather than a national one.
Activity has shifted toward retail and horizontal residential and away from urban multifamily. The projects that still pencil are less dense and lower in floor area ratio than they were eighteen months ago. Parking assumptions have not changed, and office development remains a footnote despite positive trendlines. Deals also take longer to reach a go or no-go than they used to, even as financing costs have come down.
None of this measures what gets built. It measures what gets considered, which comes first.
Watch out for the Q3 edition next quarter to see how these trendlines continue to evolve.


We've been building AI acquisitions agents with real estate GPs. On August 13, we're opening the hood in a live 2-hour workshop

Predicting six new real estate marketplaces to rise over the next decade

Covering the future of real estate and the people creating it