
The Deals Developers Are Analyzing Today | Q3 2026 Edition
A quarterly look at feasibility study activity with our friends at TestFit
A quarterly look at feasibility study activity with our friends at TestFit

Multifamily operators in the lurch; have the PMS wars begun?
A quarterly look at feasibility study activity with our friends at TestFit

Before a developer buys a site, they test it. Over the past several years, a new generation of feasibility tools has made it easy to understand what can (or cannot) be built on a site without weeks of upfront architectural work and financial analysis.
Those feasibility studies produce a useful byproduct: data on what developers are analyzing today.
TestFit, which has been the leading automated feasibility analysis platform for over a decade, processed more than 100,000 site analyses last quarter. We've partnered with the company to track the data longitudinally as a signal of where real estate development is headed, from density and parking trends to which asset classes are gaining or losing favor.
Note that this is feasibility activity, not construction starts. The data is best read as a leading indicator of where developers are looking. Nine quarters in, several trends we've been tracking strengthened in Q3.
Let’s dig in.
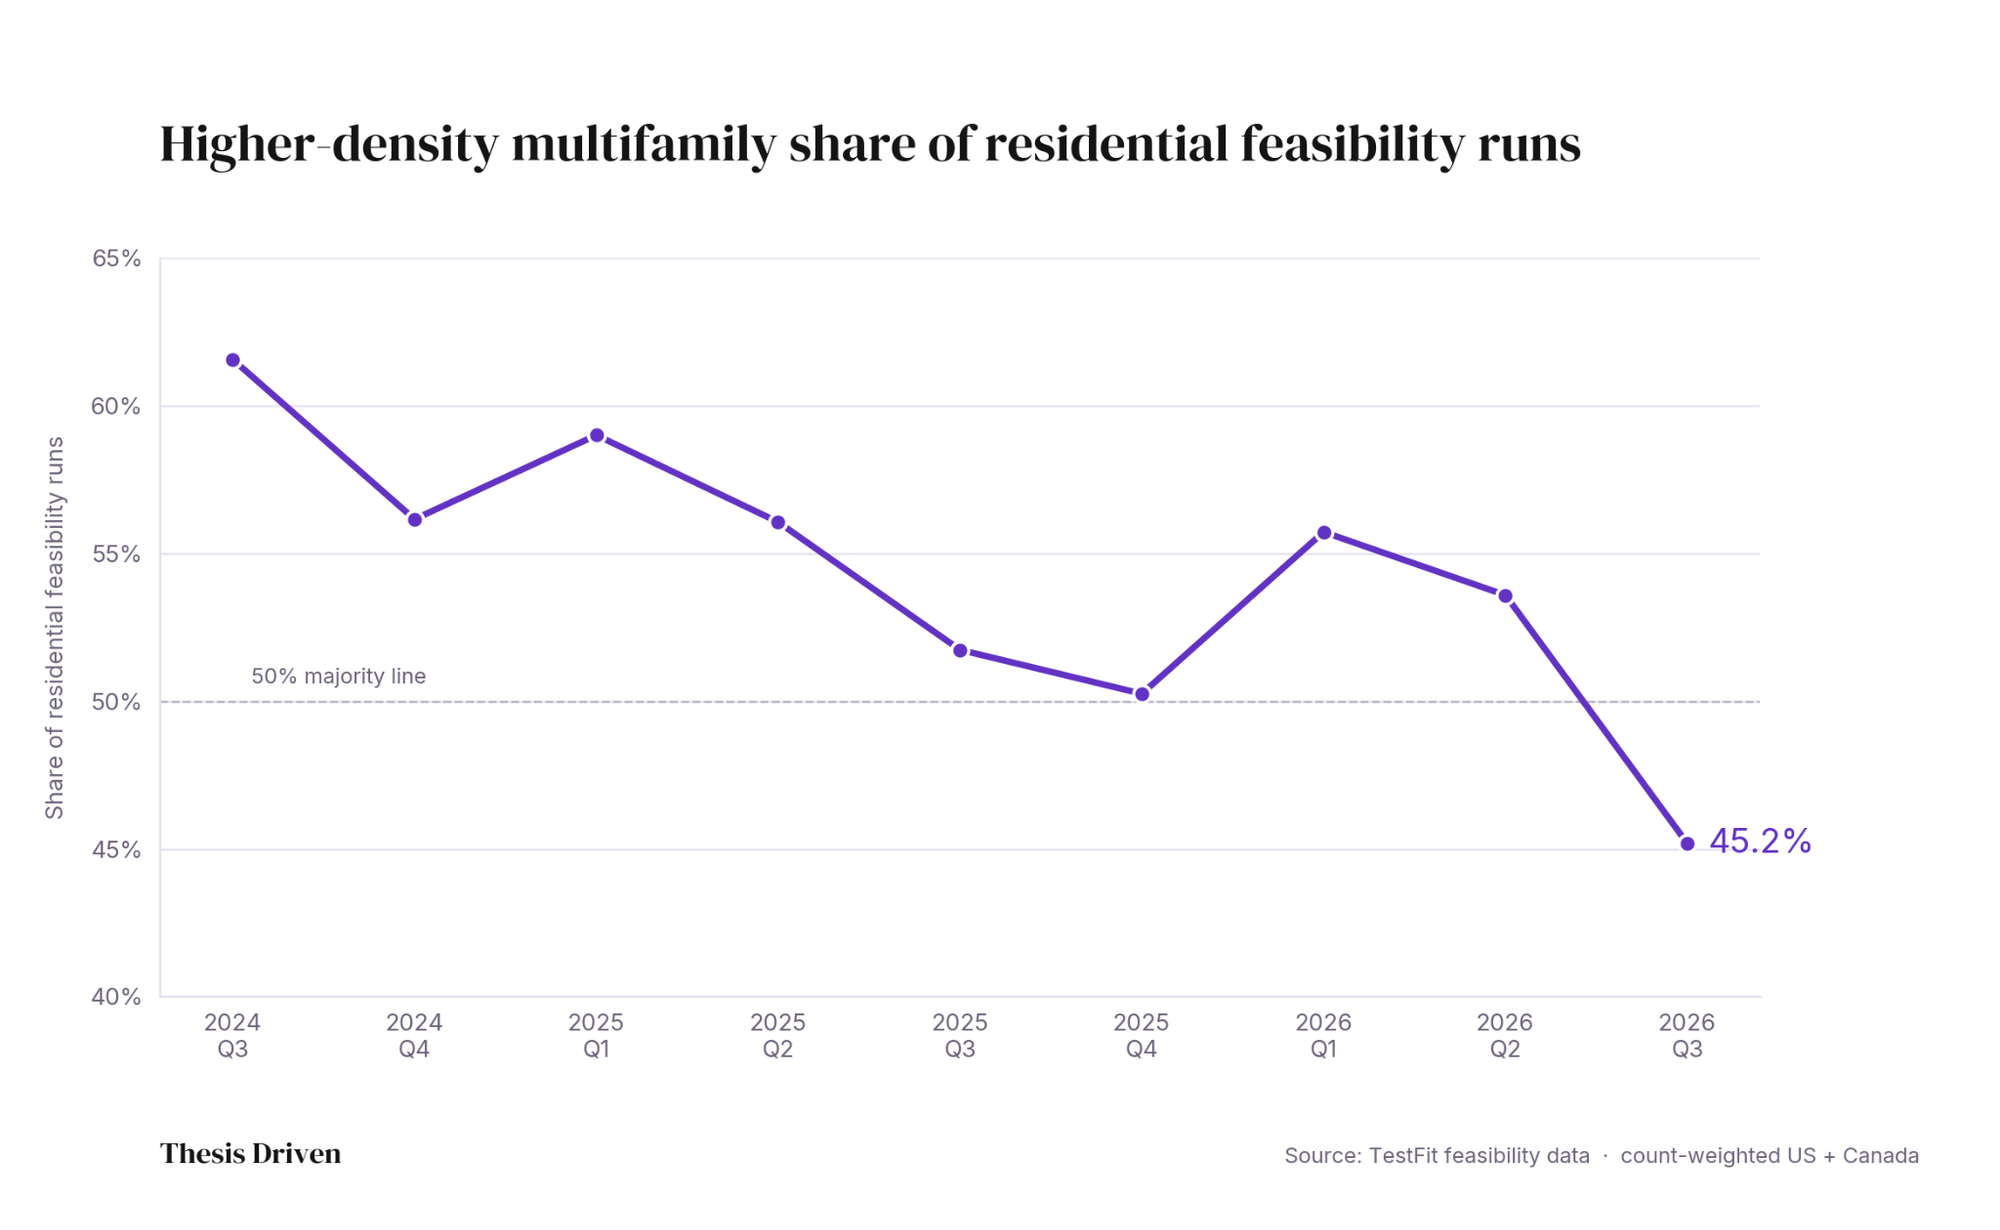
Higher-density multifamily fell from 61.6 percent of all residential feasibility runs in Q3 2024 to 45.2 percent in Q3 2026, the first time it has sat below half in the dataset. The decline accelerated in Q3.
The raw count of higher-density multifamily deals tested on the platform fell from a peak of 25,022 in Q1 2026 to 15,195 in Q3, a 39 percent drop in six months.
Within multifamily, the losses concentrated at the densest end. Projects at 120+ du/ac, the classic high-rise bucket, fell from 19.8 percent of residential activity in Q3 2024 to 11.0 percent in Q3 2026, a 44 percent decline.
Three forces are pushing conventional multifamily at the same time. Build-to-rent and other horizontal residential formats have absorbed a growing share of developer attention. Rent growth is still soft in the Sun Belt markets that caught the 2022-2024 oversupply wave. And construction costs haven't come back down even as rates have. The effective federal funds rate dropped from 5.33 percent in July 2024 to 3.63 percent today, and it hasn't been enough to revive the deals that got shelved two years ago.
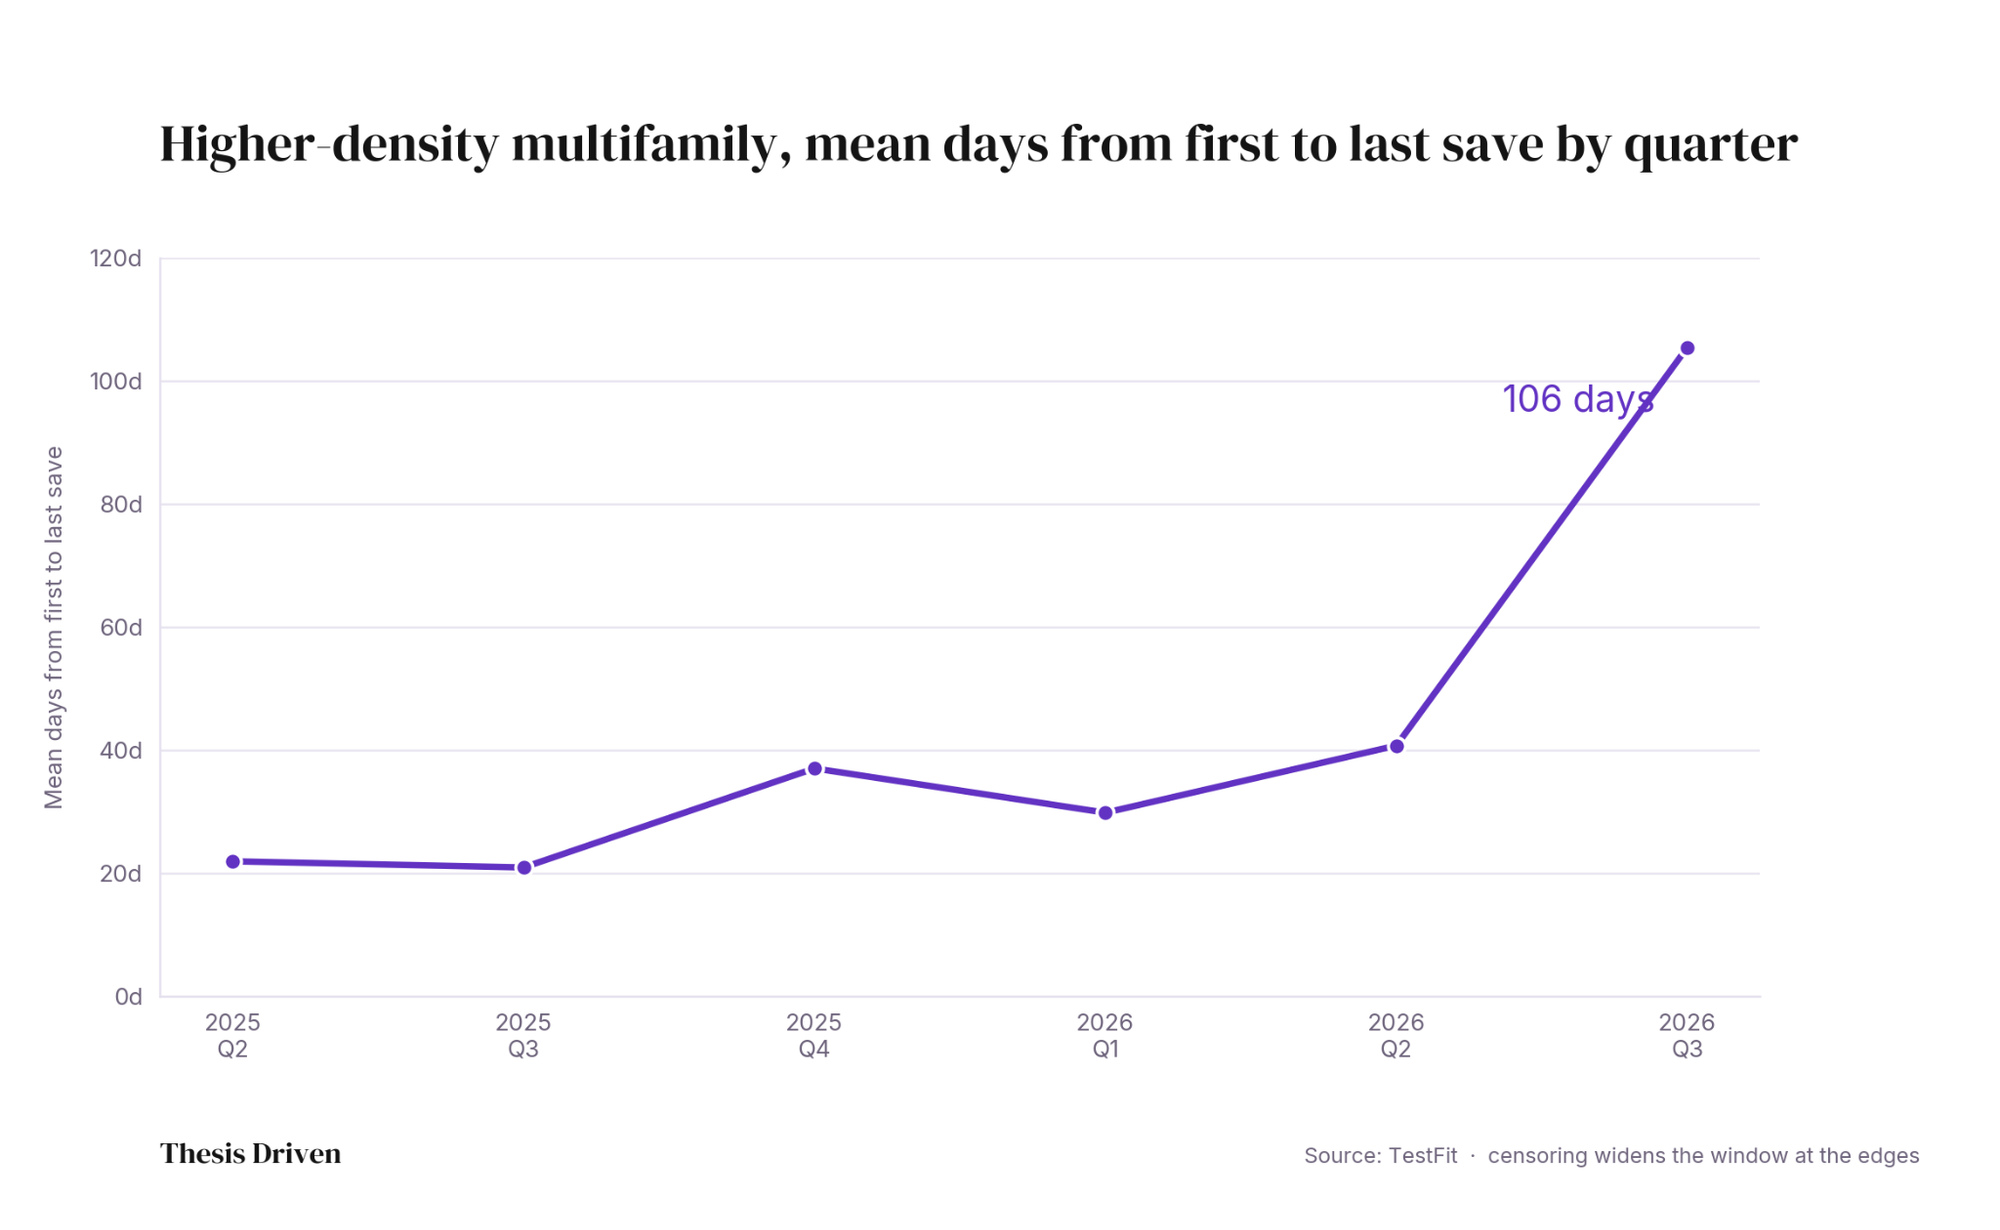
Deals take dramatically longer to run than they did a year ago.
A higher-density multifamily deal that wrapped in Q2 2025 took a mean of 21 days from first save to last. The same type of deal in Q3 2026 took 106 days, nearly five times as long.
The mean number of active days (days a user actually worked in the file) grew too, from about 3 to 7 over the same window. That's a far smaller jump than total duration, which means most of the added time is gaps between sessions. Developers are returning to each deal repeatedly, testing more variants and tightening more assumptions, rather than doing a quick best-guess analysis and moving to the next site.
The friction here isn’t the software; it's the development math underneath it, which forces developers to sharpen their pencils over and over.
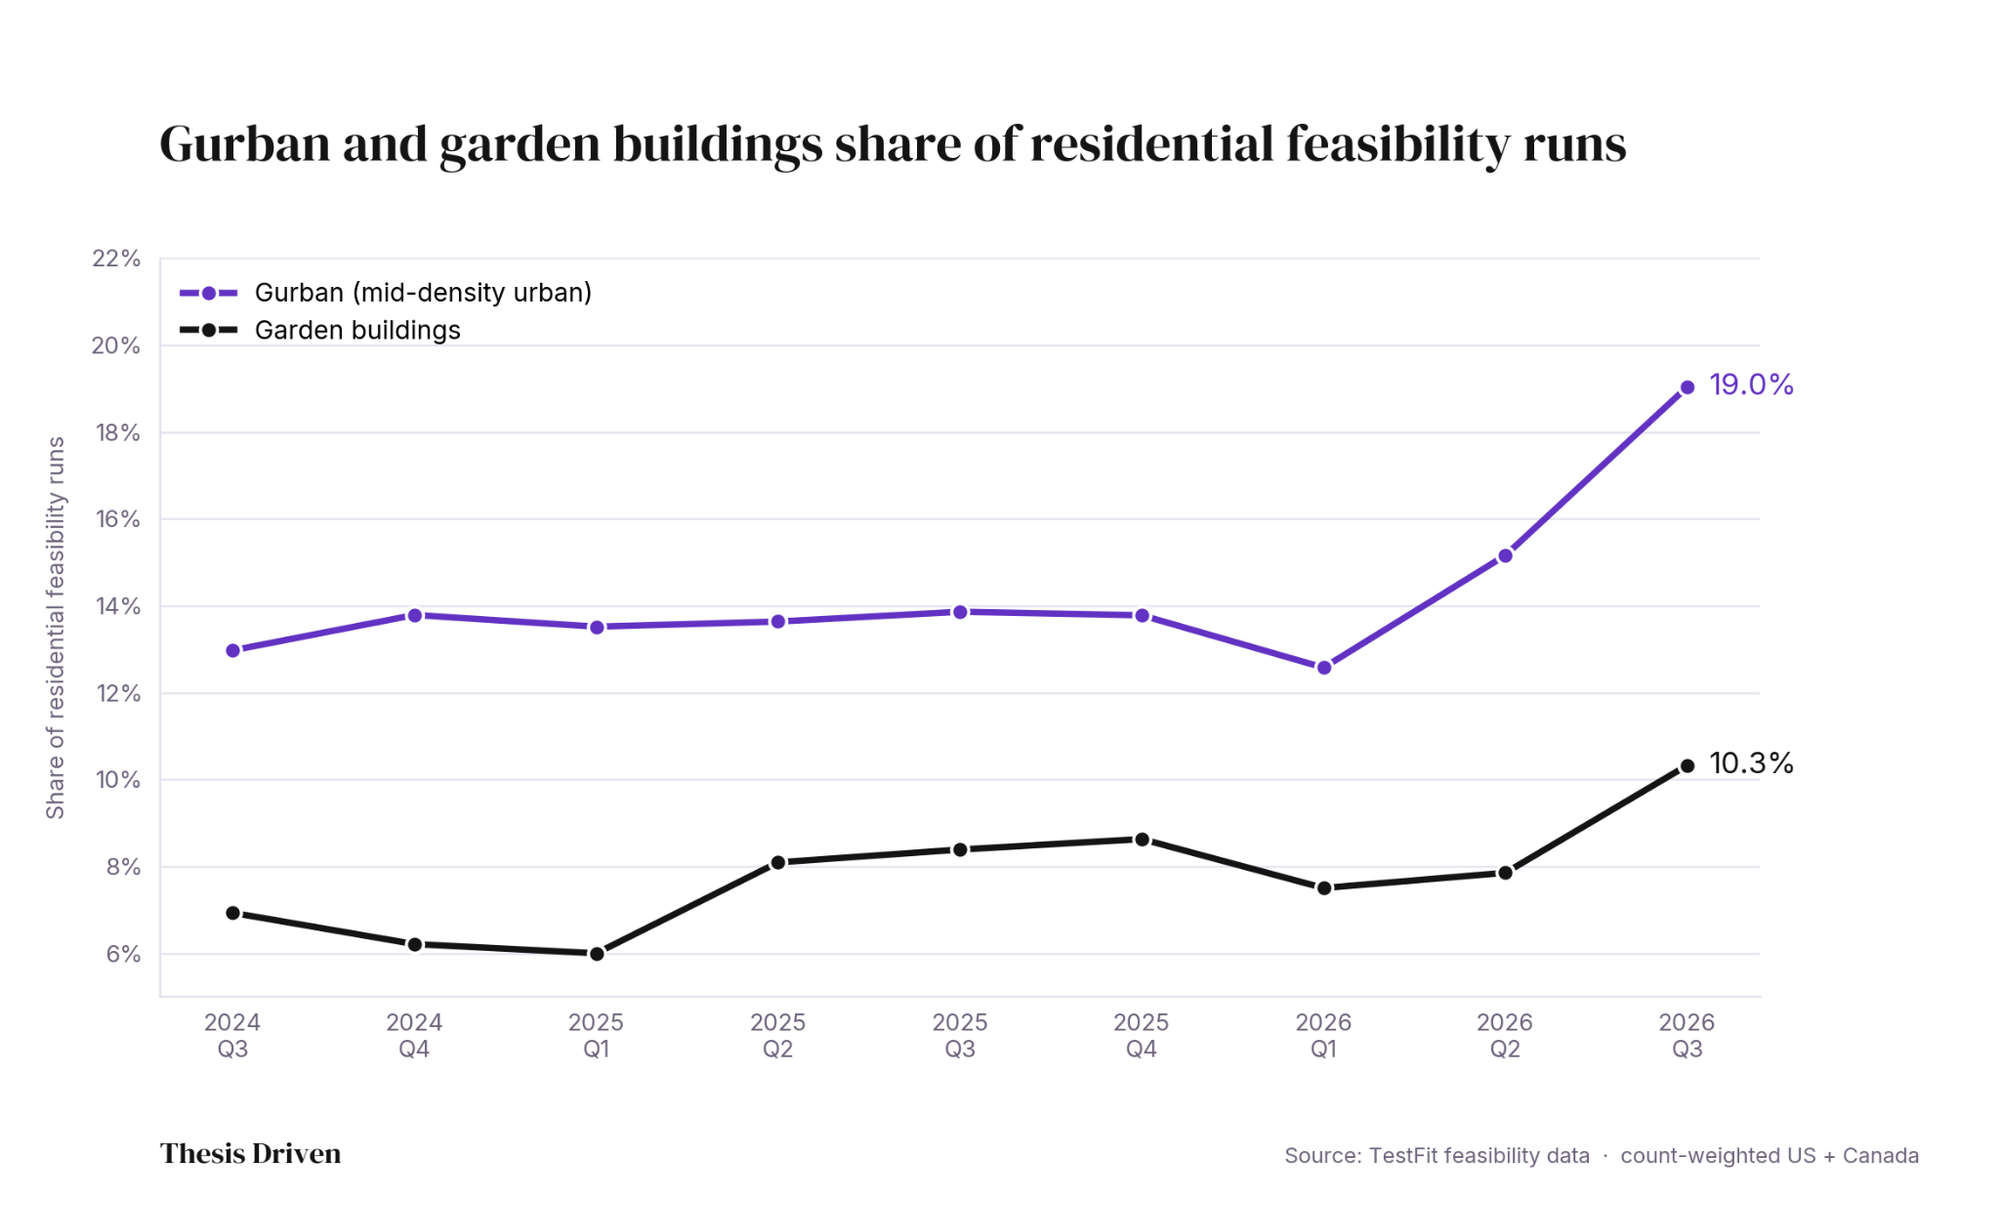
The residential activity multifamily lost went to lower-density typologies. Garden-style developments rose from 6.9 percent of residential runs in Q3 2024 to 10.3 percent in Q3 2026, their highest level in the dataset. Mid-density urban projects (what TestFit tracks as "gurban") climbed from 13.0 percent to 19.0 percent over the same window.
Both pencil at construction loan rates where concrete-podium buildings do not, and they tend to be built in markets where land costs don't force developers up the density curve to make the deal work. It's a continuation of multifamily's quiet migration away from gateway cities toward suburban and secondary markets where the math is more forgiving.
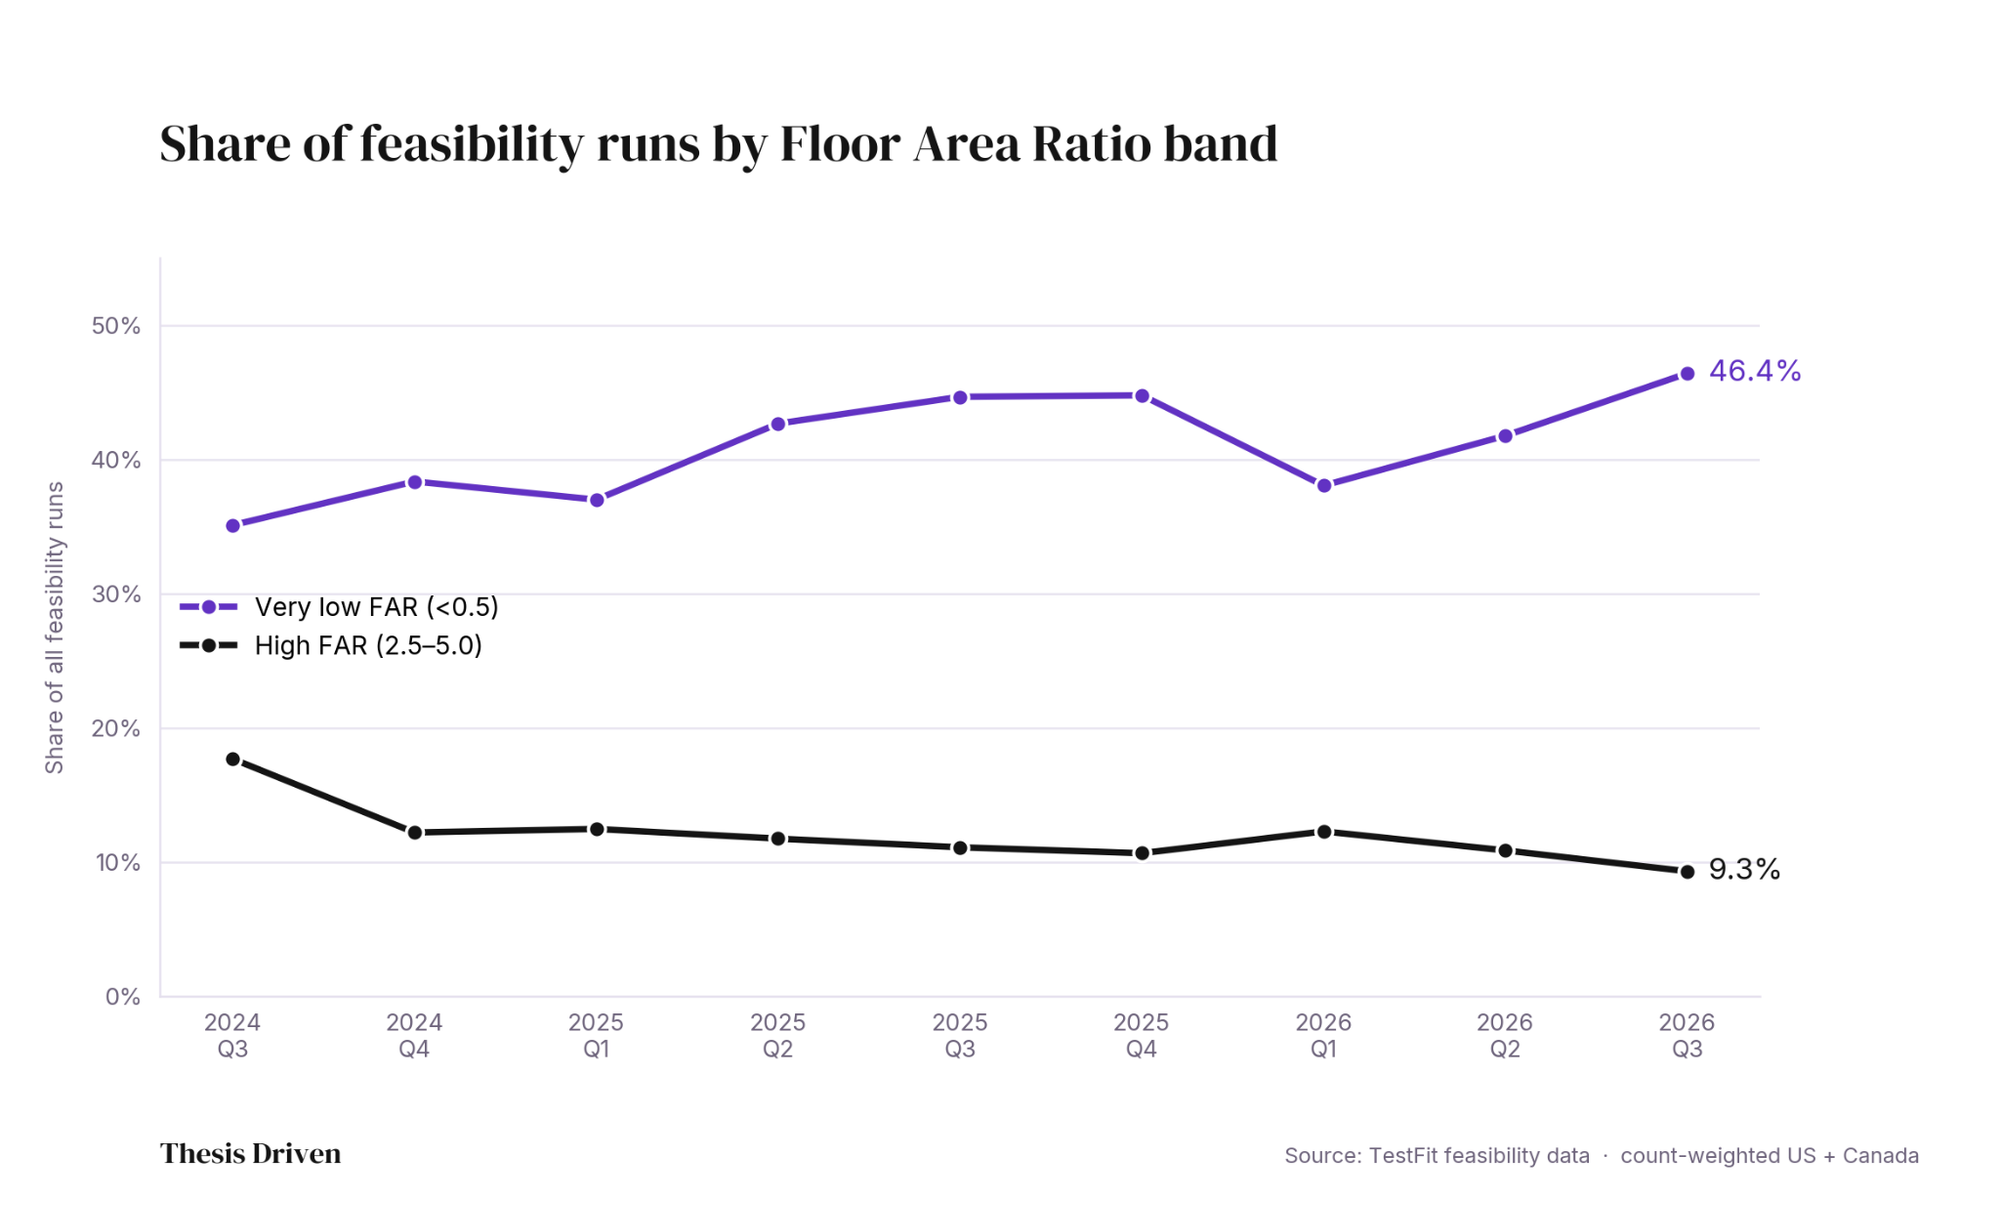
The shift away from vertical construction isn't just a residential story. Across every asset class, Q3 extended a two-year trend toward lower-intensity, more horizontal projects.
Projects in the lowest Floor Area Ratio band (under 0.5 FAR, which captures suburban retail, single-story industrial, and horizontal residential) grew from 35.1 percent of all feasibility runs in Q3 2024 to 46.4 percent in Q3 2026, a new high. The high-FAR-intensity band (FAR 2.5 to 5.0) shrank from 17.7 percent to 9.3 percent, a new low.
The drivers are the same ones bending the density curve in multifamily: every additional floor costs more to build and to finance than it did five years ago, and fewer deals generate enough revenue to cover that premium.
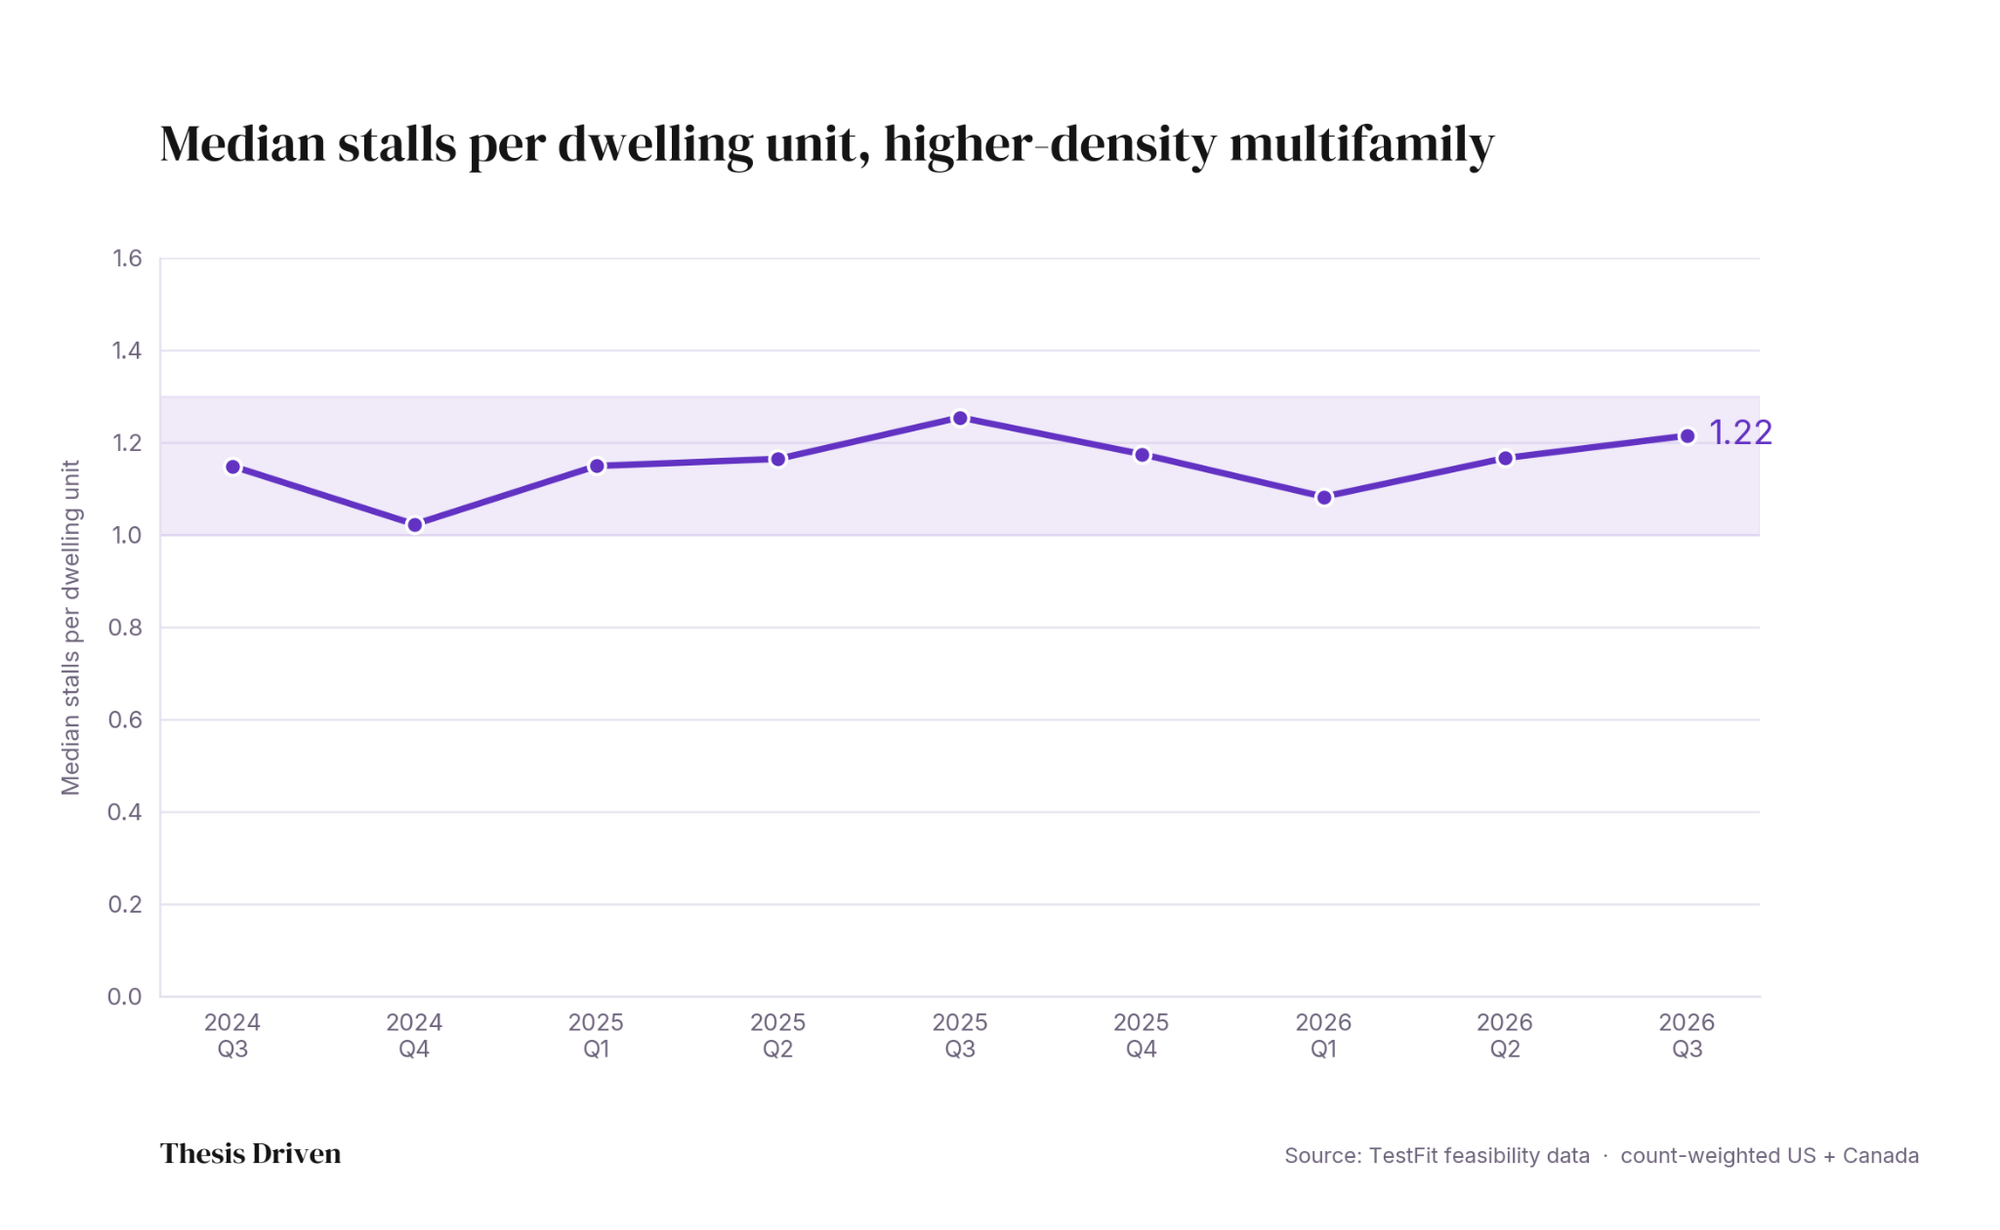
Median parking ratios for higher-density multifamily have stayed in a tight band (1.02 to 1.25 stalls per unit) as long as we've tracked them. Over the past two quarters, though, ratios have edged up from 1.08 in Q1 2026 to 1.22 in Q3, a 13 percent increase. They remain within that band, but we expect them to keep climbing.
The added parking is concentrated in the categories most exposed to softening urban rents. Higher-density multifamily and gurban saw more parking underwritten, while garden buildings and lower-density housing, where parking ratios were already closer to 1.5 and 2.0 stalls per unit, didn't budge. With lease-up incentives growing, and renters holding more options, operators are adding spaces back to their plans to compete.
The policy conversation on parking has gone in the other direction. Kansas City eliminated parking minimums in its core this spring. Virginia, Pennsylvania, and Michigan all introduced reform bills this year. None of that momentum has shown up in underwriting; developers are adding parking to compete for renters.
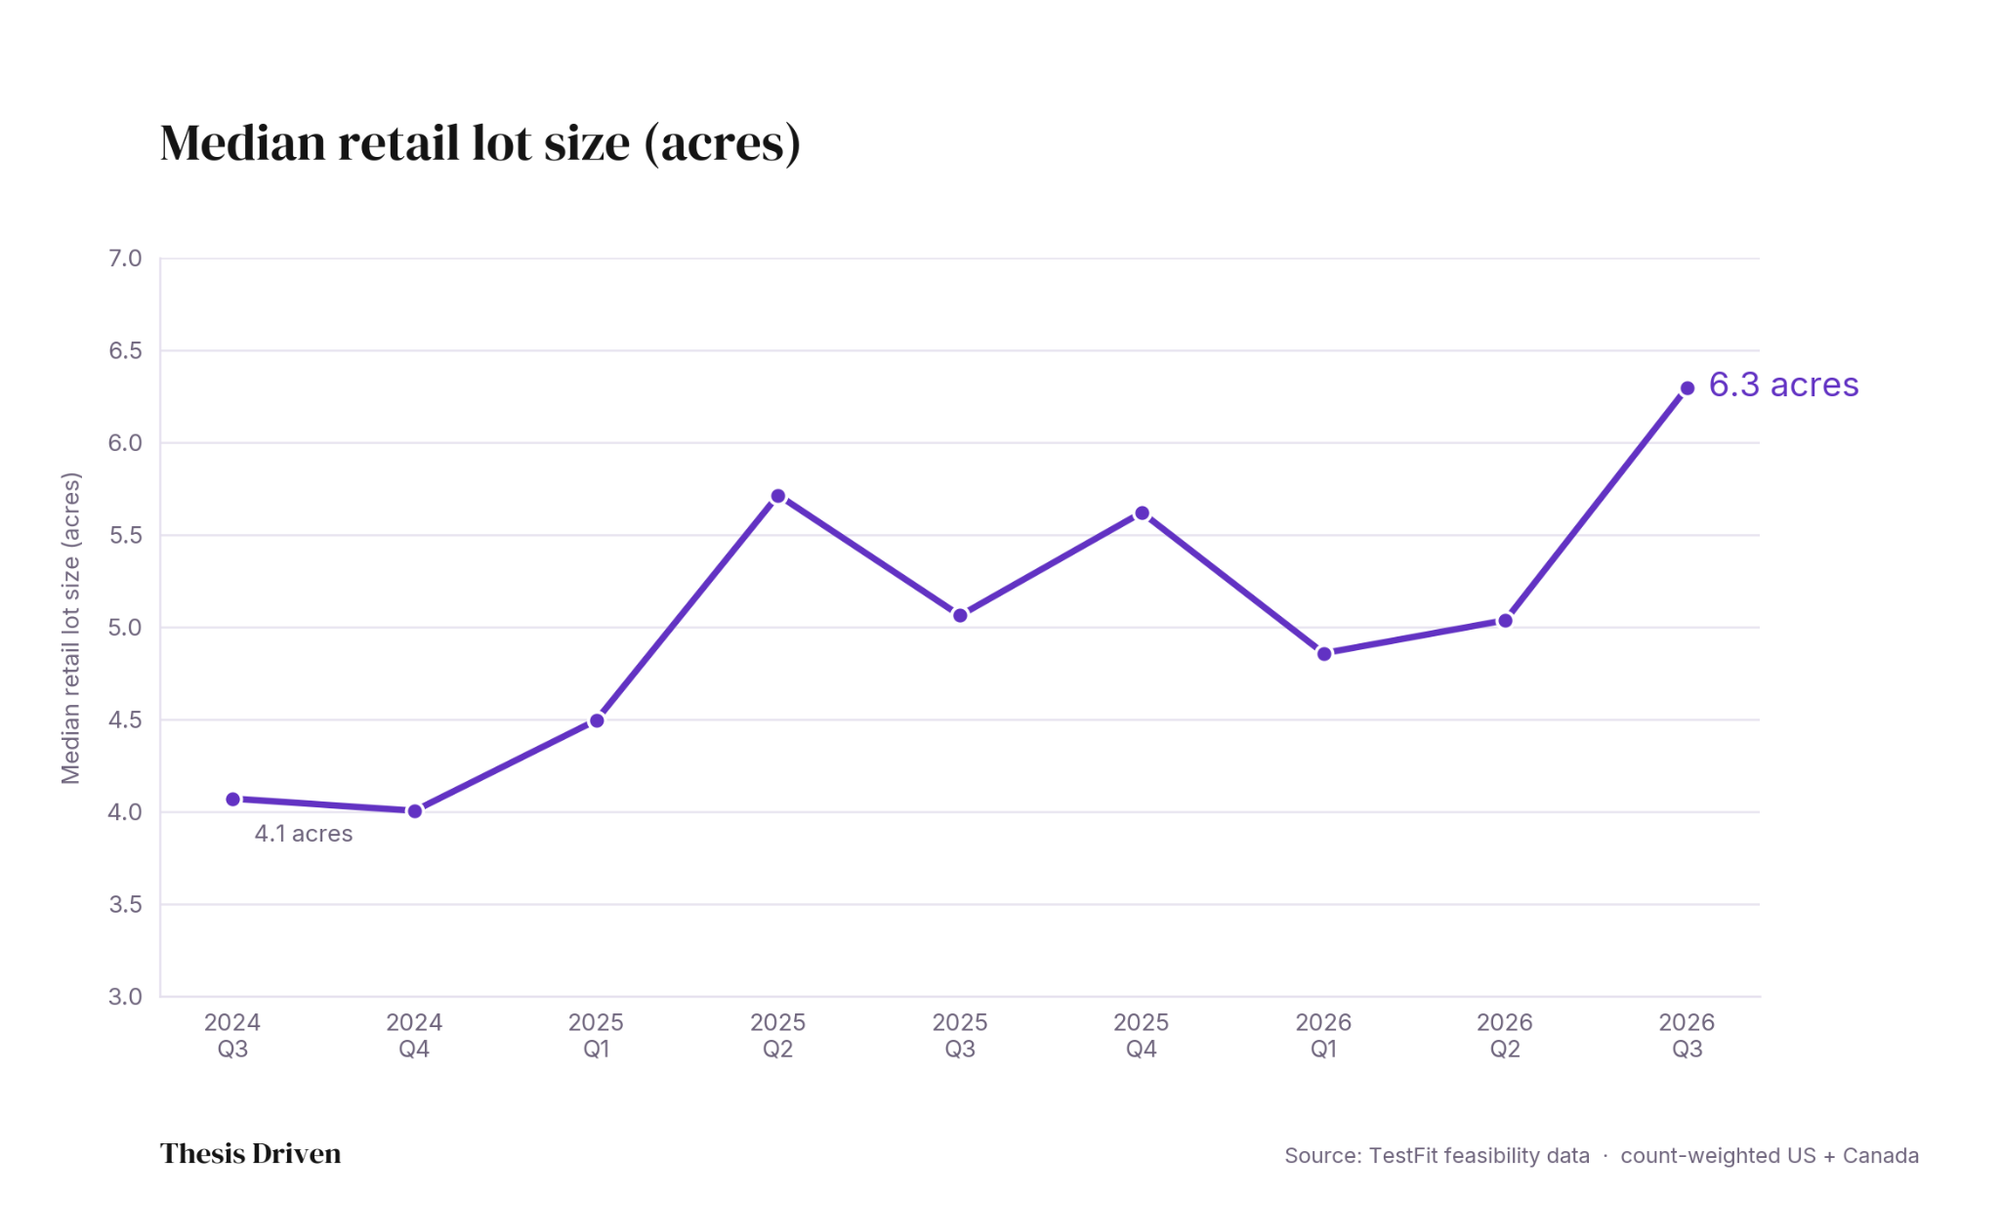
Median retail lot size rose from 4.1 acres in Q3 2024 to 6.3 acres in Q3 2026, a 54 percent increase. Median retail building square footage climbed 58 percent, from 74,000 to 117,000 square feet.
The growth reflects a shift in retail composition and demand. Four-acre sites typically hold drug stores and strip centers; sites of six acres or more hold grocery-anchored centers, junior boxes (mid-size anchor spaces), and components of larger power centers. We believe three things are driving the shift.
The first driver is grocery-anchored construction. The post-COVID retail revival has centered on necessity-based tenants, and Publix, H-E-B, Kroger, and regional grocers have been aggressively building new centers in Sun Belt and secondary markets.
Dead-mall redevelopment is also surging, pulling lot sizes up. TestFit has written about this trend. Projects like Bolsa Pacific in Orange County, an 83-acre redevelopment of the former Westminster Mall that pairs a Target-anchored 210,000 SF retail component with 2,250 homes, a hotel, and a food hall, are rewriting what counts as a "retail" feasibility study. And those sites, by definition, tend to skew large.
Financing has loosened too. CBRE's Lending Momentum Index climbed from 0.3 in early 2025 to 1.5 in early 2026, the highest level since 2021. Larger retail projects need lenders willing to underwrite them, and that market is open again in a way it hasn't been since 2021.
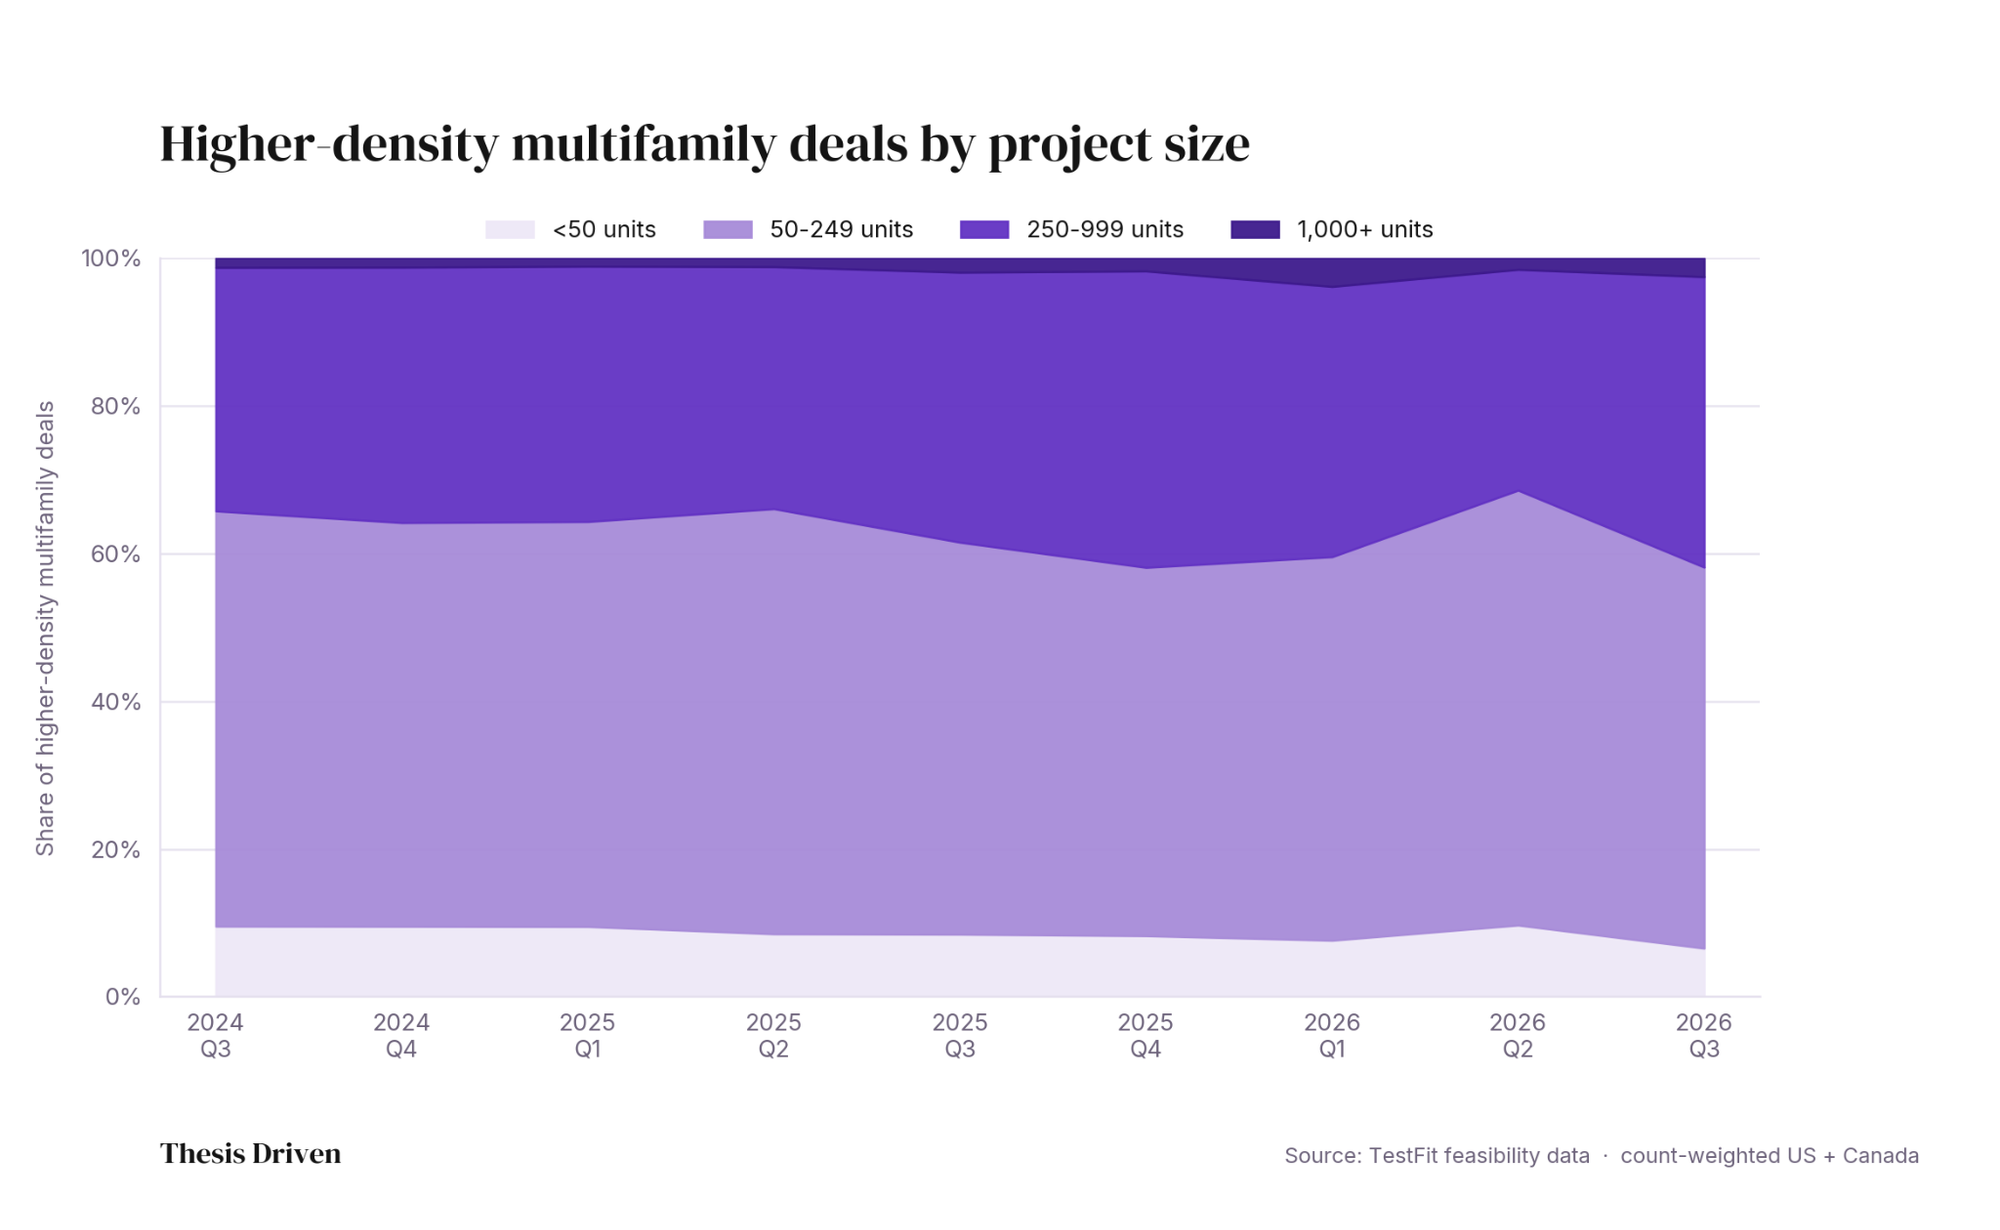
The multifamily deals that did get tested in Q3 got larger, even as the overall count fell. Median dwelling units per higher-density multifamily project rose from 174 units in Q2 2026 to 213 in Q3.
The developers still swinging at urban multifamily are concentrating on sites where land has already been assembled, entitlement is cleared, or the project scale justifies the time investment. This means fewer bets, each at a bigger scale. The thousand small infill deals that used to dominate are going away.
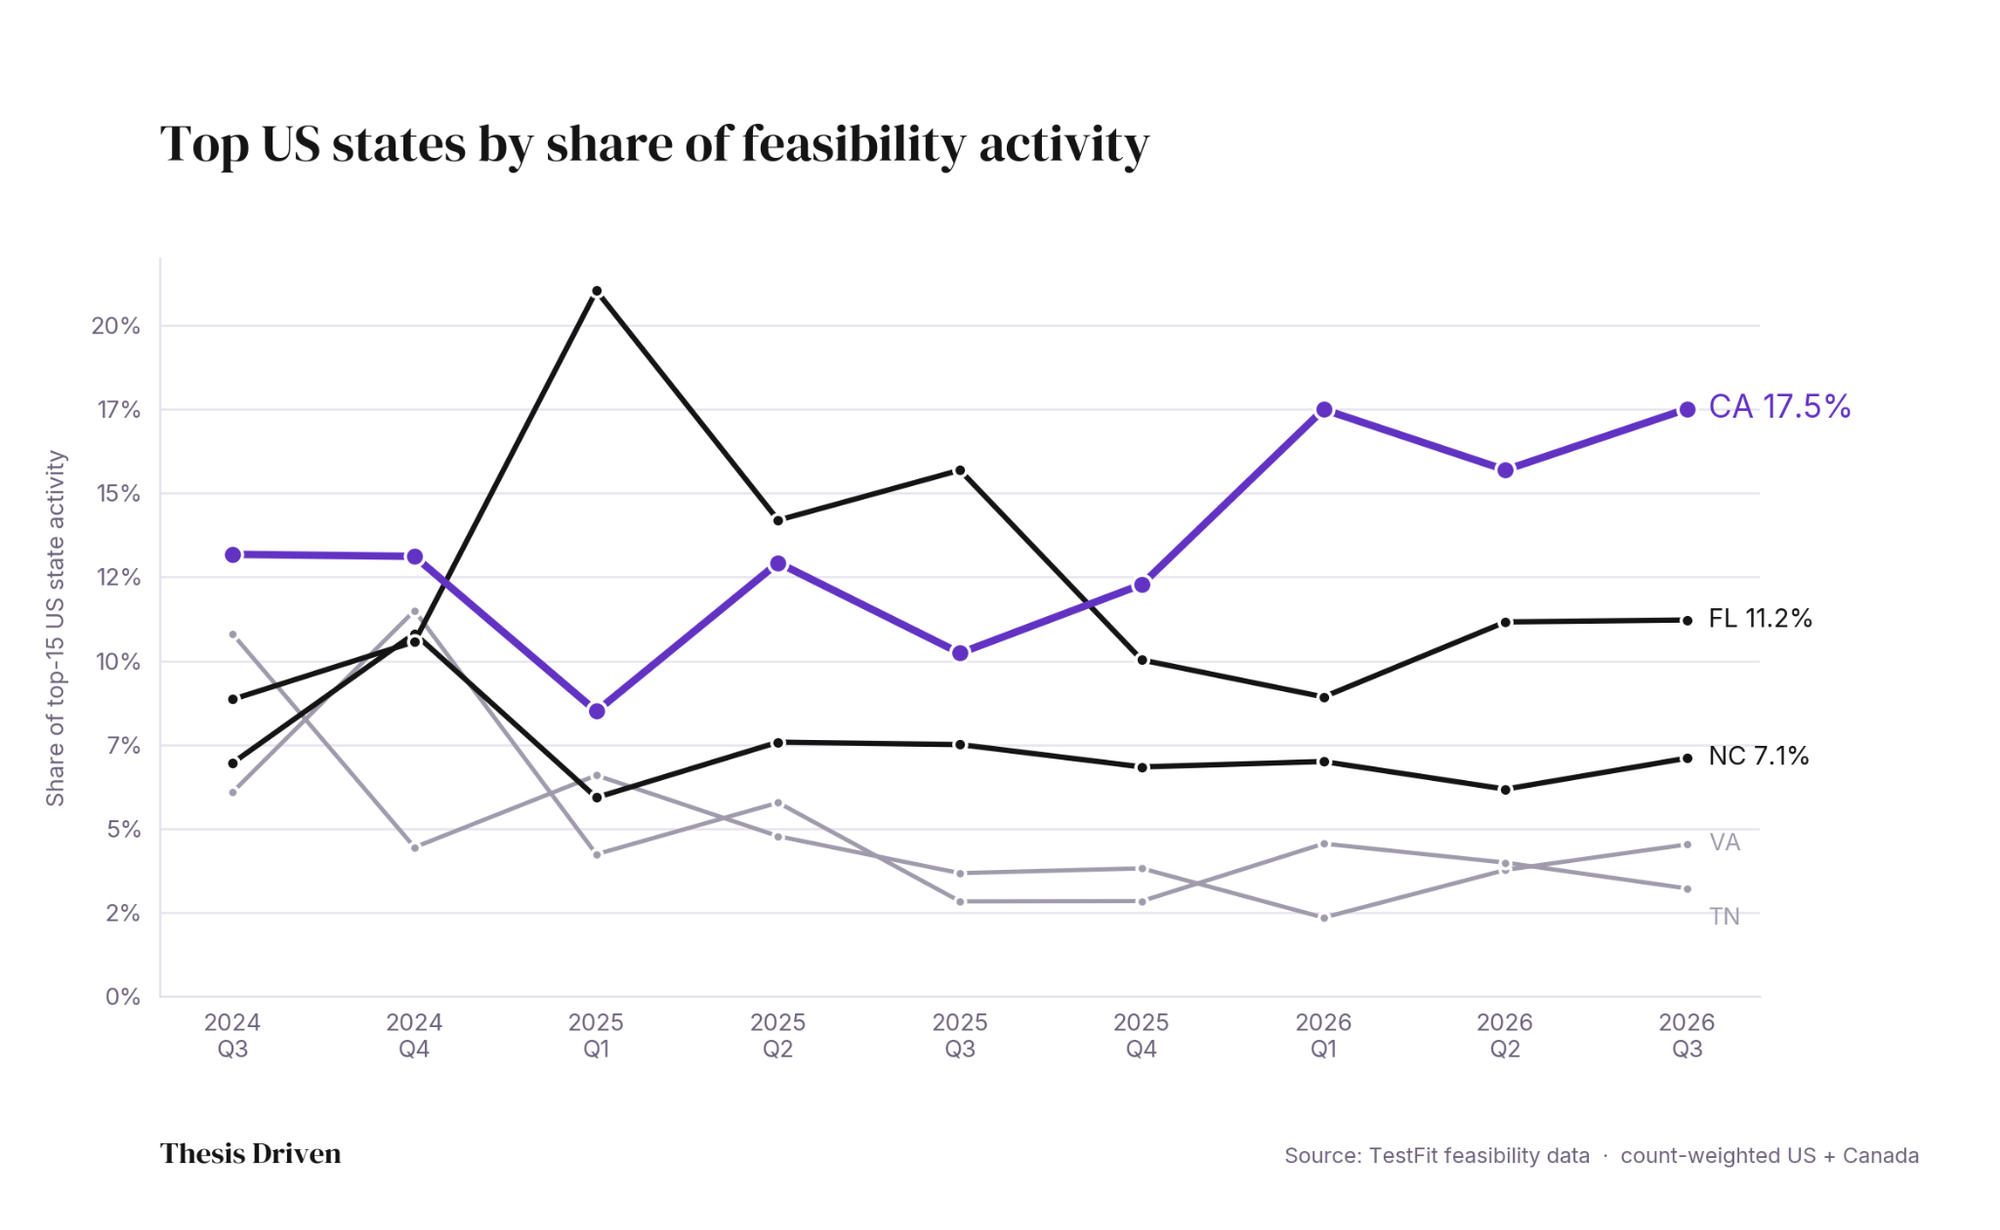
Among the top 15 US states on TestFit's platform, California's share of activity more than doubled from a low of 8.5 percent in Q1 2025 to 17.5 percent in Q3 2026. It now generates more feasibility activity than any other state by a wide margin; Florida is second at 11.2 percent.
A specific policy change is behind at least some of the gain. In July 2025, federal legislation (the so-called “One Big Beautiful Bill”) cut the bond test (the share of a 4 percent low-income housing tax credit (LIHTC) project's aggregate basis that must be financed with tax-exempt private activity bonds) from 50 percent to 25 percent. That doubles the number of affordable deals each state's bond allocation can support. California was the first state to implement the change, moving within 90 days of the federal law. Novogradac projects the shift could support 200,000 additional affordable homes in California alone over the next decade.
California developers have been responding to a series of state housing laws over the past five years, including SB 9 (lot splits and duplexes on single-family parcels), AB 2011 (by-right housing on commercial-zoned land), SB 423 (an extension of SB 35's streamlined approvals), AB 2097 (which eliminated parking minimums near transit), and expanded density bonus provisions. The bond test change is the most concrete catalyst yet.
Every project that got shelved under the old 50 percent test is now a candidate for re-underwriting. Georgia, Connecticut, Colorado, and Delaware have followed California with their own implementations, so those states should show up on this chart in future quarters.
Arizona went the other way: its share collapsed from 6.9 percent in Q2 2026 to 1.1 percent in Q3, the biggest proportional quarter-over-quarter drop for any state in the dataset. Whether it's water, cost inflation, or one-quarter noise is hard to say from the data alone, but Phoenix is worth watching next quarter to see if the pullback continues.
—
Activity continued to shift away from urban multifamily and toward lower-intensity, more horizontal projects. Multifamily developers are testing fewer, bigger deals and taking months to decide on each; retail developers are testing bigger sites with lenders back at the table. Of course, none of this measures what actually gets built; the journey from feasibility analysis to delivery is long and arduous. But it indicates where developers’ heads are. Watch for the Q4 edition in January.
-Brad Hargreaves

We've been building AI acquisitions agents with real estate GPs. On August 13, we're opening the hood in a live 2-hour workshop


Predicting six new real estate marketplaces to rise over the next decade


A quarterly read on early-stage feasibility activity with our friends at TestFit
Covering the future of real estate and the people creating it
