
Who is Investing in Real Estate Tech? 2026 Edition
Our annual list of firms actively investing in real estate technology companies
Our annual list of firms actively investing in real estate technology companies

One week out, the people building the next generation of real estate assets are gathering in one room. Thesis Driven&
A data-driven approach to unit mix, layouts, amenities, and marketing helped one Gowanus Wharf project lease faster and at higher rents in a crowded market


Today's Thesis Driven newsletter was guest written by Andrew Steiker-Epstein, Brokerage President and Chief Data Officer at Charney Companies, overseeing a 3,000-plus unit portfolio that includes Gowanus Wharf, a five-building development campus in Brooklyn.
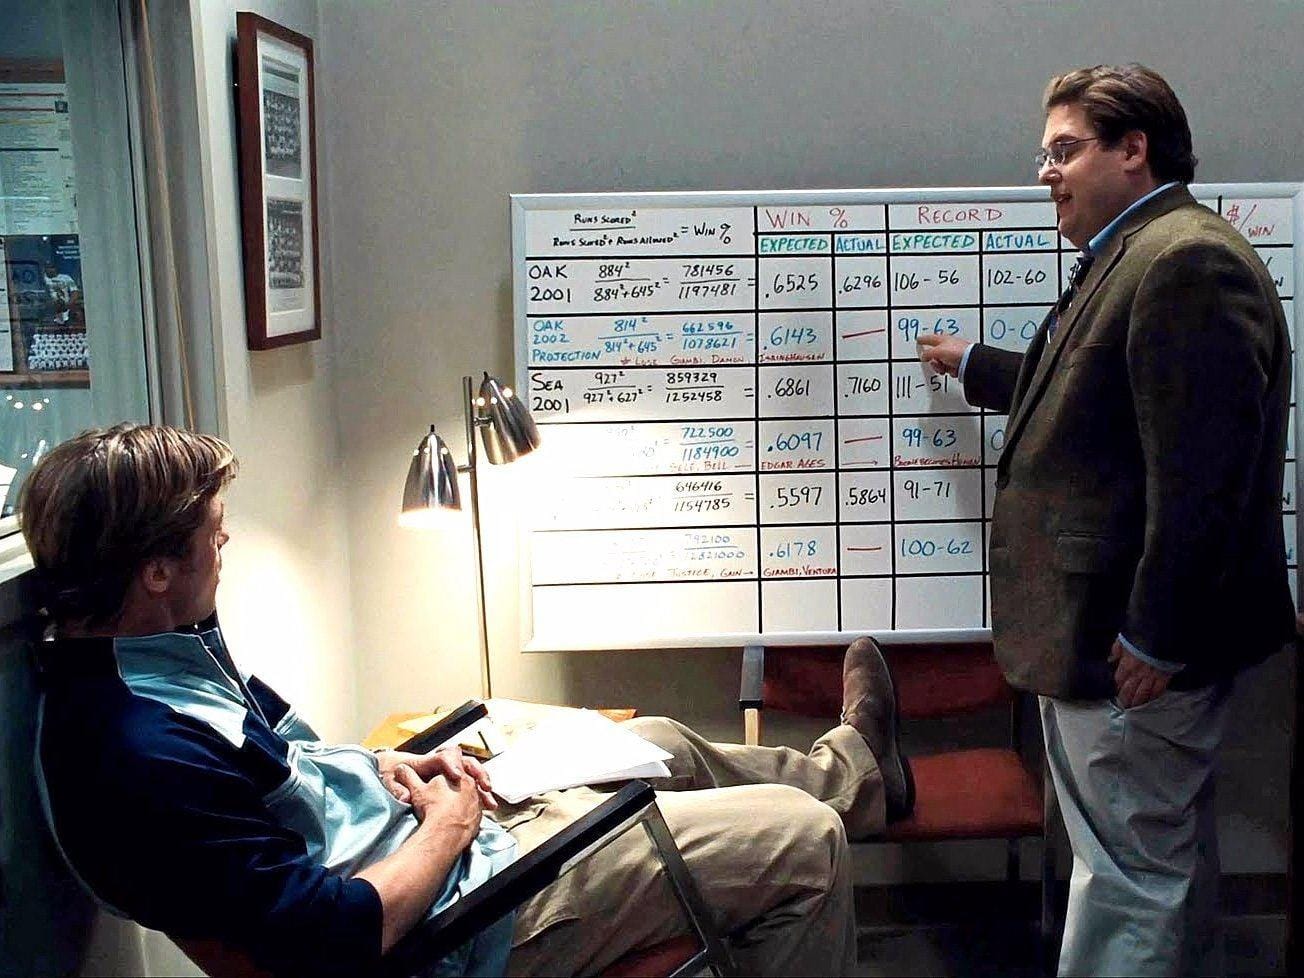
In 2002, the Oakland Athletics went 103-59 with one of the lowest payrolls in baseball. The success inspired Moneyball, the story of how General Manager Billy Beane outperformed the competition with fewer resources by leveraging data no one else was using.
Beane's insight was that baseball had been measuring the wrong things for decades, optimizing for visible attributes like batting average while ignoring the inputs that actually predicted wins.
Multifamily development has the same problem. Most operators track headline rents, absorption velocity, and occupancy and treat those outputs as the story. The decisions that actually determine those outcomes — unit mix, layout design, amenity quality, brand positioning, and marketing execution — are made before a building opens and largely treated as intuition rather than analysis. At Gowanus Wharf in Brooklyn, Charney Companies tested what happens when those judgment calls get replaced by data.
Gowanus Wharf is a five-building, roughly 2,200-unit campus co-developed by Charney Companies as part of the Gowanus area rezoning. Union Channel, the first building to open in January 2025, leased 25 percent faster than the competition and achieved rents 10 to 20 percent above market. This performance came in a crowded environment, with seven lease-ups within a three-block radius and 18 more in the pipeline, many backed by institutional developers with larger budgets and stronger brands.
Most multifamily developers face the same constraint at some point: more competition, tighter margins, or a market where the obvious moves are already priced in. The data to find a better path is sitting in public filings, architectural plans, and leasing records that every developer in any given market already has. Most of the market just isn't looking.
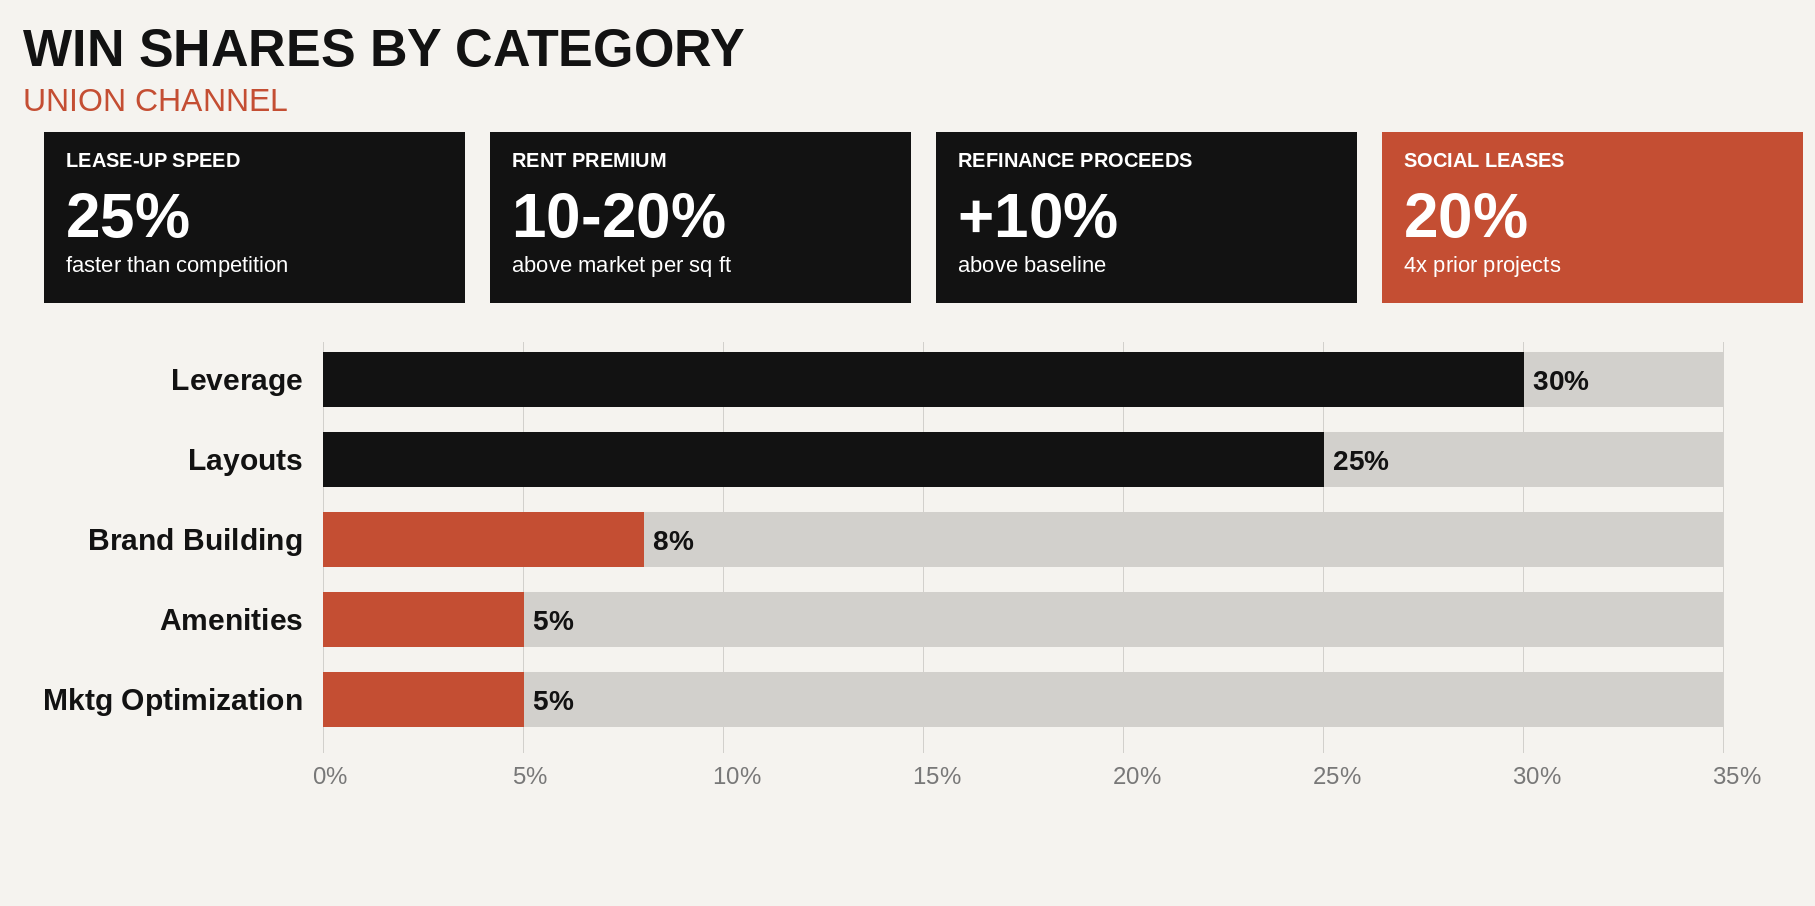
Win Shares is a sports book built around a deceptively simple question: where do wins actually come from? Which specific contributions, weighted and attributed, actually added up to the positive result? We apply the win shares framework to every project. Performance is measured across four core areas: leasing velocity, rent premium, retention, and operational efficiency. Win share is the percentage of total value created that we can attribute to a specific decision. We track this to evaluate what happened, and to improve how we approach the next project.
This letter covers five of those decisions, all made before Union Channel opened, that account for the majority of the measurable value created during lease-up. Each is assigned a win share: the percentage of total value created at Union Channel that can be attributed to that specific decision.
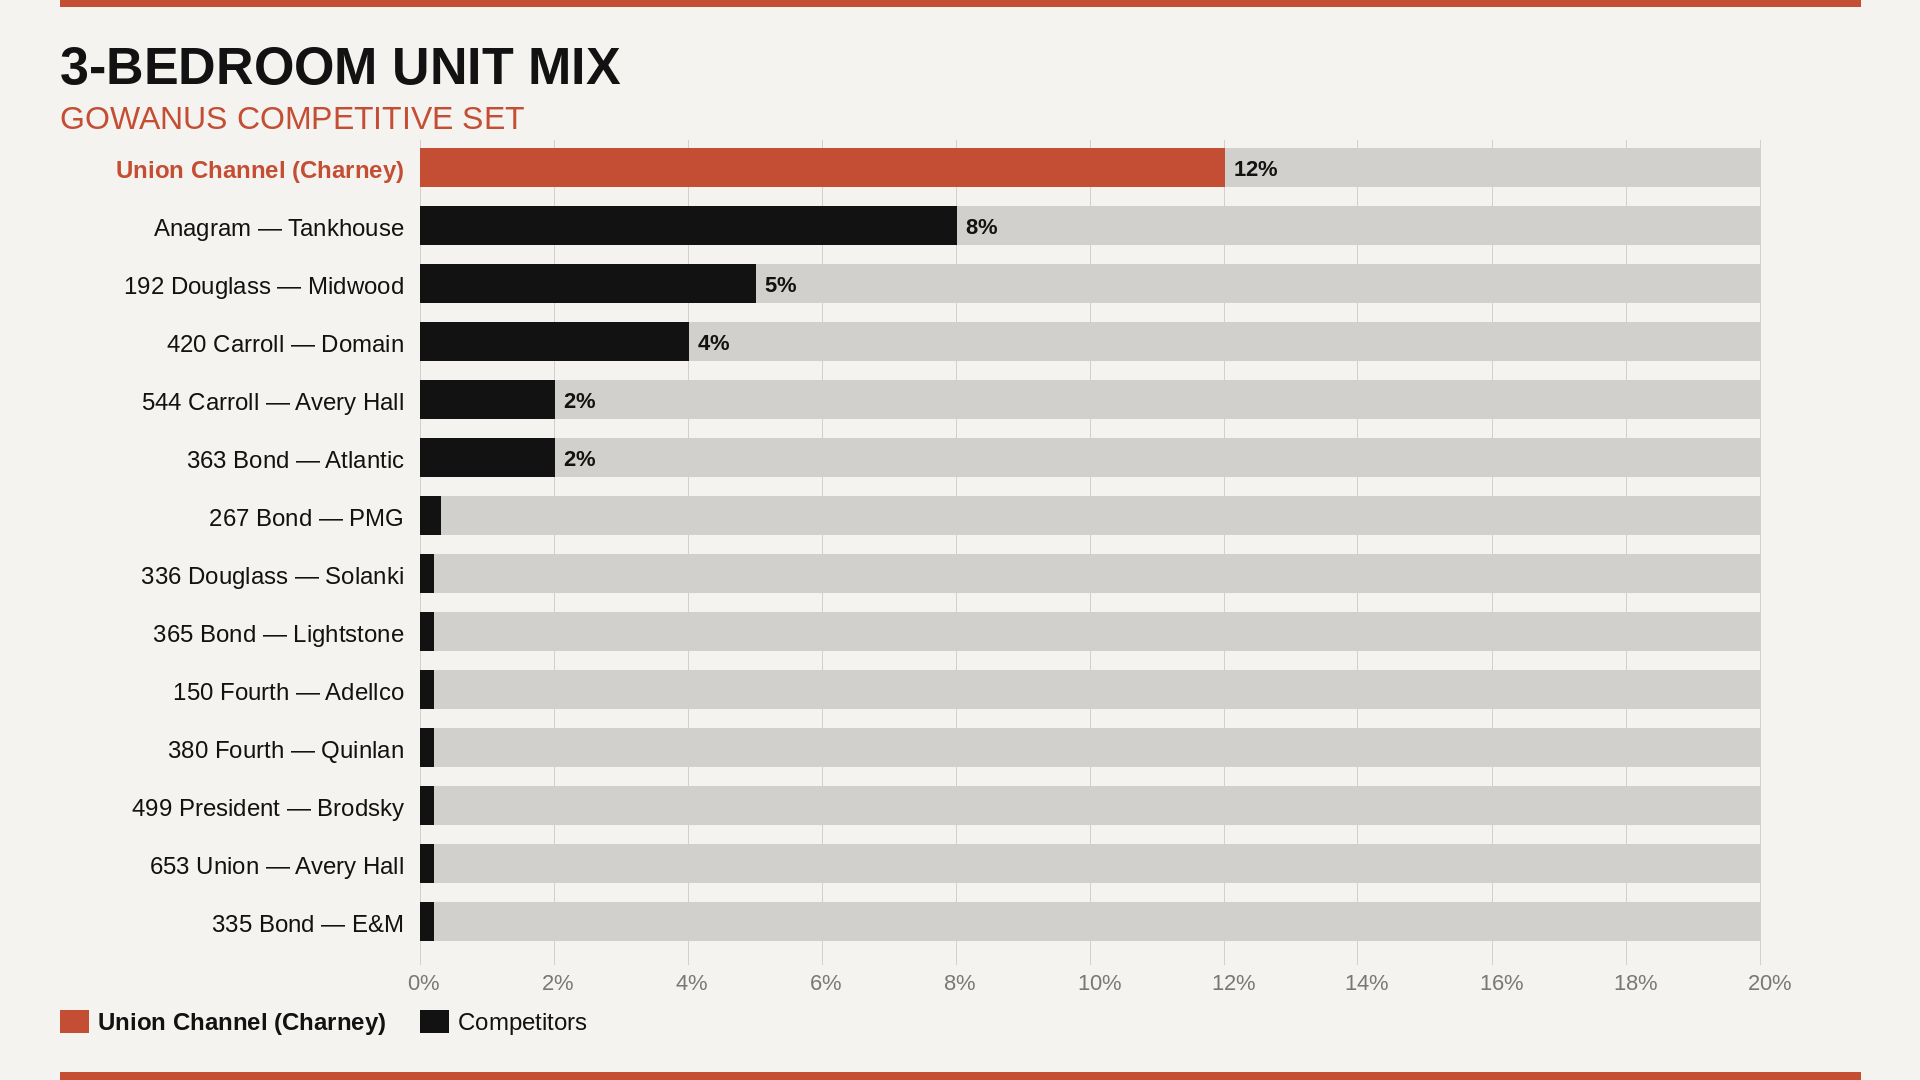
Before any design decisions were finalized at Union Channel, architectural plans for every competing project in the market were pulled and analyzed. From those drawings, unit mix, average square footage by unit type, and inferred amenity programs were mapped across the entire competitive set. The goal: identify the gap between what the market was about to supply and what renters actually wanted.
It was a significant gap. Only about 3 percent of existing supply consisted of three-bedroom units, while broader demand analysis pointed to absorption closer to 14 percent. That data was available to every developer and brokerage in the market, but none had acted on it. Union Channel's three-bedroom allocation was more than triple the market average. They were the first unit type to fully lease.
Studios presented a different kind of opportunity. They were plentiful in the market, averaging around 500 square feet and projected to open near $3,500 a month at prevailing per-foot rents; research showed that was more space and more rent than many renters wanted. Union Channel's studios were designed to 400 square feet, 20 percent smaller than the market average but priced only 10 percent below on total rent.
Both unit types leased more than 50 percent faster than the rest of the building, pushing overall velocity roughly 12.5 percent ahead of comparable projects. That acceleration reduced vacancy, pulled forward stabilization, and produced a faster refinance. Together, the rent premium and velocity translated into roughly 10 percent more in refinance proceeds.
Unit mix is 30 percent of win shares, the largest single category, and the most consistently overlooked. Most owners focus on headline rents and absorption. The decisions that determine those numbers rarely get the same analytical rigor. That's where the edge is.
The same analytical approach applies to layouts, where the findings are less intuitive and, for that reason, more valuable.
Renters know when they love an apartment; they rarely know exactly why. Location, size, and price drive most leasing decisions, but within those constraints there is room to influence how a unit feels, and how much someone will pay for it.
What renters most respond to, sometimes without realizing it, is the size of the living room. Of all the layout variables tested across hundreds of units, living room width is the single strongest predictor of rent per square foot.

A wider living room lets two people sit across from each other comfortably. It makes a couch look like a choice rather than a compromise. It also allows for more windows and better light, which renters feel immediately.
Once living room width became the organizing principle, every other layout decision followed from it. Kitchen configurations, bar depths, and circulation patterns were all calibrated to protect that space rather than compress it. Combined with tighter floor plan efficiencies, the result is units that consistently rent above comparable buildings. The 25 percent win share figure reflects the rent lift above what comparable units in the market achieved.
The amenity data for the Gowanus project pointed in one consistent direction: the conventional wisdom is dead wrong.
The industry assumption is that more amenities signal more value. But renters don’t think that way. They are not comparing checklists; they are looking for a few things they can picture themselves using. In the correlation studies, quality of select amenities consistently outperformed breadth of amenity programs, and of every amenity type, fitness center quality had the strongest relationship with rent per square foot.
Differentiation matters for a related reason. Developers typically benchmark their amenity programs against the competition, which means everyone ends up with roughly the same package and then competes on price.
Two decisions shaped the amenity program at Union Channel. The first was the gym; rather than designing it in-house, Charney hired The Wright Fit, a specialist gym consultant, whose layout produced three squat racks, top-tier equipment, and a space that uses every square foot. The data is clear on this: a compelling, premium gym is a reason to pay more in rent.

The second was whether to give Union Channel residents access to amenities across all four Gowanus Wharf properties. The decision was to open it up, and it became a central part of the leasing narrative: residents will eventually have access to a basketball court, spa and sauna, rooftop pool, and rooftop mini golf spread across the campus.
Resident surveys found that 9 percent of respondents cited the amenity campus or the gym as a primary reason they chose the building, pointing to an additional 15 leases. The compound effect on NOI and refinancing suggests a 5% impact on value created above baseline.
A senior executive at a major institutional developer made the argument to us recently that branding doesn't move rents, markets do.
It is a reasonable instinct, but it isn’t right. Twenty percent of Union Channel's leases came directly from social media, more than four times the rate on prior projects. The approach started with hiring a creative agency that had never worked on a real estate project. The logic: an agency already shaped by how the industry markets itself was not going to produce anything the industry hadn't already seen.
The strategy that emerged was built around the unique neighborhood rather than the building. Murals went up on the construction fencing in partnership with Arts Gowanus, who were later given retail space for pop-up exhibitions. Local artists, business owners, and community leaders were interviewed and featured across the building's platforms. Before a single unit was finished, Union Channel had more than 3,000 organic Instagram followers.
The conversion rate on those leads was nearly twice that of traditional listing portals. By the time the building opened, those renters already knew what they wanted.
A strong brand also makes the leasing team more effective, the resident experience more resonant, and the renewal conversation easier — effects that are real but difficult to attribute cleanly to a single decision. Brand effects are also harder to isolate than the other categories. Looking strictly at the 15 percent bump in lease volume relative to prior projects, 25 additional leases can be traced directly to the branding strategy.
Changing a cover photo was worth five additional leases. Systematic testing of listing images is one of the most consistently overlooked levers in multifamily marketing.
Controlled A/B tests across cover images, architectural renderings, finished units, amenity shots, and lifestyle photography showed that the right photo for each unit type consistently drove more clicks, more tours, and more signed leases. The rooftop pool rendering produced the highest overall engagement. Lower-priced units converted better from lifestyle imagery; higher-end units responded better to interior photography. Applied systematically across every listing, the lift added up to ten percent more leads and five leases.
None of this required new inventory, new budget, or new infrastructure. The listings already existed. Paying closer attention to what was already there, and testing rather than assuming, is what produced the result.
Across all digital marketing, the same approach produced 14 additional leases, accounting for 5 percent of win shares.

The Yankees won 26 World Series titles through 2000. Since then, just one. The game evolved around them and they held on to an old model.
The same pattern plays out in multifamily. Institutional developers are not bad operators. Many are excellent, and some are running analytical programs more sophisticated than anything described here. The decisions that drove Union Channel's results came from looking at the same information everyone else had and asking a different question: what actually drives the outcome?
The five categories in this letter account for 73 percent of the value created at Union Channel, all from decisions made before the building opened. Each compounds into the next: faster lease-up produces earlier stabilization, earlier stabilization supports a better refinance, and a better refinance means more capital to deploy on the next project. The data to pursue all this exists in every market. Operators who start asking better questions of it will be very difficult to compete against.

Our annual list of firms actively investing in real estate technology companies

Predicting six new real estate marketplaces to rise over the next decade

As AI eliminates administrative burden and capital consolidates around scaled platforms, operational performance is becoming a primary driver of returns


How a new model for rural communities built on shared identity is driving both demand and backlash
Covering the future of real estate and the people creating it